Predicting Winterkill: going from in-green sensors to the causes of damage

Categories
Services
Written by
Bryan C. Runck

Winter damage is one of the most difficult things to manage on a golf course because, by the time you can see it, much of the evidence for what caused it is gone. 

You walk by a green in April and find dead turf. Was it crusted snow and ice that formed during a February thaw and refreeze? Was it saturated soils in a low spot of the green? Or was it exposure to wind where snow blew clear in January? Each is a different winter, and while we can currently make educated guesses about what caused the damage, we've never had the data to pinpoint what exactly happened.

It's this problem - teasing apart the causes of winter injury - that the WinterTurf project is solving.

Data for Predicting Winter Damage

Over the past six years, you've partnered with us to collect data that we never had before: 327 golf courses, 23 winters of historical surveying, on-course sensors, global satellite data, and over 1,600 course-season observations of what the winter did and whether the turf survived (Figure 1).

Figure 1: Damage observations combining historical damage surveys and end-of-season surveys. 

Map of 327 WinterTurf study golf courses across North America and northern Europe, 2002-2026; symbol size shows how many seasons each course was damaged and color shows maximum damage severity.


What this data has allowed us to do is build first-of-a-kind machine learning models that can accurately identify the locations where winter damage happened and forecast where it might show up in the spring.

Helping Machines Learn Agronomy

The major challenge we've faced now that we have a robust dataset has been that machine learning models don't understand plants well. Typically, these models are built using purely "data-driven" approaches, where all of the data is fed directly into the model, and then the model figures out what does and doesn't matter. 

This didn't work for winter damage though because it's caused by both the winter conditions that a turf stand is exposed to and the hardiness of the turf itself.

To overcome this problem, we've built models that incorporate the best of machine learning with knowledge of how a plant responds to its environment and acclimates during the fall in preparation for winter. We also built into the models what we know about the mechanisms driving winter damage to explicitly account for freeze-thaw cycles, saturated soils, high light and low temperature, among others.

Models to Forecast Winter Damage

The results from all of this data and machine learning are encouraging. Tested against winters the model had never seen, it ranks damaged course-seasons above undamaged ones about 75% of the time.

We also asked whether all of this work with the in-green sensors was worth it, or could we have only used satellite data? And what we found was that the in-green sensors improved classification and forecast skill to over 81%, but because we had fewer observations, that skill was unstable across model configurations.

What is causing damage?

In addition to classifying courses and forecasting damage, we also built a model to infer the mechanisms causing it. Going back to the early work of James Beard out of Michigan State University, we've known for a long time that winter damage is caused by a mixture of abiotic and biotic factors. Our attribution models currently reflect this for abiotic factors alone (see Figure 2), and while preliminary, illustrates where future work is headed.

Figure 2. Inferred dominant mechanism of winter damage for A) North America and B) Europe. These are not able to be directly ground truthed with the datasets we currently have acquired and will be a focus of future research.

Two maps comparing the model's inferred dominant winter-damage mechanism - low-temperature kill, ice encasement, crown hydration, or desiccation - with observed damage rates across North America and Europe.


What comes next?

As scientists, we'll of course always say we need more data, but in this case, the models show that's true. We need more observations of winter damage at the same sites we put in-green sensors so that we can continue to increase our forecasting skill. Our current modeling work shows that in-green sensors are the way to get accurate in-winter forecasts that will be able to reliably recommend specific actions to mitigate damage before it happens.

Right now, a particular weakness is that we don't have the data to fully validate our attribution model (displayed for a course in Figure 3). We're further expanding our remote sensing pipelines to help with this and doing more analysis of the weekly surveys, but without more in-green direct measurement, we're limited in what we can do. 

Figure 3. Damage risk graph through a winter for a single course.

Line chart of daily mechanism-attribution scores for one golf course through the 2024-25 winter, with low-temperature kill dominant in early winter and crown hydration dominant in spring.


Sign Up

If you're interested in helping make these systems better, there are three ways to join.

First, you can sign up for our pilot that will send regular reports to you about your golf courses' winter risk: https://z.umn.edu/interest-survey

We will be providing regular forecasts sent to peoples' emails about your current winter injury risk and recommendations for what you can do. See an example in Figure 4.

Figure 4. Example of WinterTurf regular report that superintendents can sign up at this link: https://z.umn.edu/interest-survey.

Example WinterTurf greens committee report for a golf club, showing an executive summary, a per-green risk table, and recommended actions.

Second, you can request to host a sensor and donate to help us maintain and expand our fleet. Our large USDA grant funding this work ends in August of 2026, so we're running on a shoestring budget while we write grants for additional federal funding. Each in-green sensor costs roughly $4,500 to manufacture along with staff time to maintain the fleet and generate reports. 

Every bit helps, and those interested can contact Eric Watkins at [email protected] about how to make a contribution.

Lastly, we'd like to thank the National Institute of Food and Agriculture, U.S. Department of Agriculture, Specialty Crop Research Initiative under award number 2021-51181-35861 and the Minnesota Golf Course Superintendents Association who have supported this work in the past. Without those past investments, we wouldn't be to this point and every winter we're one more closer to consistent forecasting of winter damage.


 Banner photo: "Frost on Alderley Edge Golf Course" by Colin Park, via Geograph / Wikimedia Commons, CC BY-SA 2.0 (cropped)

WinterTurf hackathon and 2024–2025 sensing update

Categories
Written by
Ann Piotrowski, Majid Farhadloo, and Bryan Runck

As the WinterTurf 2024–2025 data collection season comes to a close, the WinterTurf sensing nodes are being removed to make way for spring maintenance and regular golf course operations. This winter marked our largest data collection effort yet, with 75 sensing nodes deployed across the northern hemisphere at golf courses and research sites. These nodes collected 702,905 data packets and 16,713,955 sensor readings, capturing the daily changes that influence turf health during the harshest months of the year.

By refining our technology and pursuing collaborative research, we aim to equip superintendents with the knowledge they need to protect and maintain their greens throughout the winter.

Technological advancements in WinterTurf sensing


This season, our team introduced sensing improvements to our data collection and sensor monitoring efforts. Our new Command Execution (CommandExe) support tool for our v3 data logger enables a remote command function to check connectivity and fine-tune functionality. Additionally, our updated dashboards provide real-time diagnostics, improving our daily monitoring capabilities.


With every season comes challenges. Some courses experienced poor cellular signal or quality, not allowing the node to send data in real time and limiting our remote access for diagnostics. To address this issue, our system is designed to store all data locally on an internal microSD card, which we can download once the node comes back to the lab in the spring. Another challenge in winter is the limited sunlight – our system relies on incoming solar energy with a battery backup. During the darkest months, some nodes still require manual battery charging by course superintendents, ensuring continued operation in very low-light conditions.


Exploring data through a multidisciplinary hackathon


Recently, we had an exciting two-day intensive hackathon event that included researchers, data scientists, and turfgrass experts. The meeting aimed to generate research questions and uncover patterns at a fast-paced tempo using our growing and extensive dataset. The group explored questions such as:


  • How do CO2 accumulation rates differ between these three cover conditions: ice, impermeable covers, and impermeable covers and ice (Figure 1)?
  • Which combination of fall practices correlates most strongly with reduced winterkill damage?
  • How do light intensity levels under different covers correlate with turfgrass recovery rates?


A bar graph showing weekly average CO2 levels under various winter turf cover types including impermeable covers and ice.

Figure 1. Exploratory bar graph showing weekly average CO2 levels under cover types: impermeable covers, ice, both ice and impermeable covers, or other cover type. Credit: Majid Farhadloo.


While the hackathon was mainly exploratory, it identified new directions for future research. The collaborative meeting highlighted the value of multidisciplinary analysis in understanding complex environmental data.


A banner image representing WinterTurf data collection efforts on golf courses across the northern hemisphere during winter.

A banner image representing WinterTurf data collection efforts on golf courses across the northern hemisphere during winter.


Final thoughts


Our goal remains the same: to provide golf course managers with research-based knowledge and tools for winter turf management. By refining our technology and pursuing collaborative research, we aim to equip superintendents with the knowledge they need to protect and maintain their greens throughout the winter. As we reflect on another successful season, we look forward to further advancements. Stay tuned for more updates as we continue to dig into the data.


​This activity supported in part by: MnDRIVE Global Food Ventures, University of Minnesota

A Prototype Tool for Integrating Agrometeorological Data Across Sources

Categories
Written by
Bryan C. Runck

As part of our ongoing work to improve the use of environmental data in agricultural research, we recently published a prototype tool that integrates multiple agrometeorological data sources into a unified access and querying system. This tool demonstrates how general-purpose extract-transform-load (ETL) systems can reduce overhead and improve data usability for digital agriculture workflows.

Researchers often spend a lot of time downloading, cleaning, and reformatting the same climate datasets from multiple providers. Each data source has its own format, API conventions, and spatial-temporal structures. Our prototype simplifies this by offering a standardized, open-source interface that harmonizes disparate sources and automates many of the most common processing tasks.

Man Typing on Computer with stats and graphs depicted


Built with extensibility and usability in mind, the system includes separate ETL managers for each dataset and supports spatial and temporal aggregation across user-defined parameters. Outputs can be downloaded as CSV or JSON, and users can access the tool through either a graphical user interface or a RESTful API. The system currently runs on Windows, Mac, and Linux and is designed to be lightweight and usable by researchers without extensive programming backgrounds.

We used Minnesota as the case study for this prototype. We were able to explore how researchers might customize queries for specific cropping systems, field experiments, or landscape-scale assessments. We believe this kind of data interface is especially important in the context of changing climates, where the ability to quickly assemble regionally and temporally relevant data can support adjustments to cropping calendars, irrigation schedules, and other time-sensitive decisions.

The project was supported by the Minnesota Environment and Natural Resources Trust Fund and the Legislative-Citizen Commission on Minnesota Resources. We hope this prototype serves not only as a useful tool for others but also as an example of how modular ETL architectures can be applied more broadly to agricultural and environmental research challenges.

The code is available under an open-source license


To see related activities by Bryan Runck, check out my Lab Page.


​This activity supported in part by MnDRIVE Global Food Ventures, University of Minnesota

The Power of Real-Time Geoinformation Systems

Categories
Services
Written by
Bryan Runck

Revolutionizing Agriculture

In recent years, the fusion of artificial intelligence (AI), machine learning (ML), and the Internet of Things (IoT) has opened up unprecedented opportunities for agricultural innovation. One groundbreaking development in this arena is the implementation of real-time geoinformation systems, which promise to revolutionize agri-environment research by enhancing data quality, scalability, and cost-efficiency.

The Rise of Spatial IoT in Agriculture

As the agricultural sector increasingly relies on AI and ML for knowledge discovery, the need for large, high-quality datasets has become paramount. Spatial IoT technologies, which involve deploying internet-connected sensors throughout agricultural environments, have emerged as a crucial tool in this data-driven landscape. These sensors collect real-time, high-resolution geospatial and temporal data, enabling researchers to monitor and analyze agricultural systems with unprecedented precision.

Challenges in IoT Implementation

Despite its potential, the implementation of IoT in agriculture presents significant challenges. Managing large fleets of devices while maintaining data quality is a complex task. Scientists often start with one-off prototypes, but scaling these to thousands of internet-connected devices requires overcoming numerous technical and logistical hurdles.

Case Studies in IoT System Development

The University of Minnesota’s Real-Time GeoInformation Systems Lab has been at the forefront of addressing these challenges. Since 2019, the lab has developed and deployed over 2,727 IoT devices across four continents. This extensive deployment has provided valuable insights into creating a generalizable, open-source spatial IoT system tailored for agricultural research. This work was summarized in a recent pre-print on Arxiv.com (Runck et al. 2024).
One key aspect of the lab's work has been the iterative development of the IoT system, progressing through three major and fourteen minor versions. Each iteration has refined the system's capabilities, from improving sensor accuracy to enhancing data transmission reliability. The current version of the system is designed to be scalable, ensuring that it can be deployed widely while maintaining high data quality.

Practical Applications

The applications of these IoT systems are diverse and impactful. For instance, in irrigation management, real-time data on soil moisture and temperature help optimize water usage, crucial in regions facing water scarcity. Similarly, in plant winterkill research, sensors monitor microclimates to understand the conditions leading to crop damage in cold environments. These insights enable farmers to adopt preventive measures, safeguarding crop yields.
Another notable application is in meteorological observations. Deploying IoT systems for weather monitoring provides granular data that enhance the accuracy of weather forecasts, which is vital for agricultural planning and risk management. For example, in Minnesota and Malawi, extensive networks of weather stations equipped with IoT sensors collect data that support both local farmers and broader agricultural research initiatives. However, paying attention to data quality, access and interoperability matters, often coupled with fit-for-purpose analytic pipelines, is key to ensuring real-time, geo-sensed data lead to actionable, data-driven informatics products.

The Role of Open Source in Scaling IoT

Open-source technology plays a crucial role in the scalability of IoT systems. By making design files and code publicly available, researchers can build on existing work, ensuring broader adoption and continuous improvement. This collaborative approach aligns with the scientific principles of transparency and reproducibility, fostering innovation across the agricultural research community.

Moving Forward: GEMS Sensing Service

To support the ongoing development and deployment of IoT systems, the University of Minnesota has established GEMS Sensing, a service organization within its GEMS Informatics Center. This initiative aims to provide turnkey IoT solutions for researchers, ensuring that the technology is accessible and sustainable. By offering both internal and external sales models, GEMS Sensing facilitates public-private partnerships, driving further advancements in digital agriculture.

Conclusion

The integration of real-time geoinformation systems into agricultural research marks a significant leap towards smarter, more sustainable farming practices. By harnessing the power of spatial IoT, researchers can collect and analyze data at an unprecedented scale and resolution, paving the way for innovative solutions to some of agriculture's most pressing challenges. As these technologies continue to evolve, the future of agriculture looks increasingly data-driven and resilient, promising enhanced productivity and sustainability for the global food system.


Image: Generated with Firefly. of A modern agricultural field with IoT sensors placed at various points.


​This activity supported in part by MnDRIVE Global Food Ventures, University of Minnesota

Using AI to Revolutionize Sustainable Farming

GEMS Informatics and Water Quality Management

Fertilizers are essential for boosting crop yields and increasing farm productivity. However, excessive use of fertilizers not only incurs high costs for farmers but also leads to harmful runoff that pollutes waterways. To address these challenges, GEMS Informatics is collaborating with the Minnesota Department of Agriculture’s Water Quality Certification Program and colleagues from the University of Minnesota. Together, they are leveraging AI and data science, in combination with ground-truth and remote-sensed data, to inform farmers of best management practices and track the water quality outcomes of those practices at scale.

The Problem with Over-Fertilization

While fertilizers play a crucial role in modern farming, their overuse can be detrimental. Excess fertilizers often wash into nearby water bodies, causing environmental pollution and financial waste for farmers. The key to effective fertilizer management lies in precise measurement and informed decision-making.

Harnessing Data for Sustainable Practices

Brad Jordahl Redlin, Water Quality Certification Program Manager at the Minnesota Department of Agriculture, emphasizes the importance of GEMS Informatics' work: “GEMS is building the analytical backend, linking farmer fields to watersheds and monitoring ongoing water quality. This will enable us to measure the positive effects of our certification program.”

Kevin Silverstein, Operations Manager at GEMS Informatics, adds: “We use satellite imagery to support government policy. Partnering with the Department of Agriculture, we train machine learning programs to recognize sustainable practices like strip-till or no-till farming, and cover crops and buffer strips that prevent water runoff. We can then correlate these practices with their impact on water quality and provide recommendations to the certification program.”

Advanced Monitoring with Satellite Technology

In collaboration with CFANS colleague and remote sensing water quality expert Leif Olmanson, GEMS Informatics employs satellite technology and supercomputers to monitor water quality. Monthly averages of satellite signals provide comprehensive measurements across Minnesota’s lakes, even those seldom exposed to direct sunlight.

Machine learning algorithms developed by GEMS require regular, unobstructed satellite signals. To ensure accuracy, GEMS imputes missing data using adjacent pixels in time and space. This approach turns vast amounts of data into actionable insights, empowering policymakers and farmers while safeguarding privacy.

Jim Wilgenbusch, Director of Research Computing at the University of Minnesota, praises GEMS Informatics' innovative approach: “It’s extremely exciting that they push at the boundaries of what researchers traditionally considered possible. GEMS sits at the intersection of a database where you store, catalog, and organize information, and modeling that information on a massive scale. It has huge potential to support researchers in their work at the cutting edge.”

A Collaborative Effort

GEMS Informatics integrates efforts from various University of Minnesota schools and institutions, including U-Spatial, Research Computing, the Data Science Initiative, the Minnesota Supercomputing Institute and the College of Food, Agricultural, and Natural Resource Sciences. Additionally, GEMS partners with state institutions like the Minnesota Department of Agriculture and multinational companies to drive data-driven innovation in the agri-food sector.

By combining AI, data science, and collaborative efforts, GEMS Informatics is paving the way for sustainable farming practices that benefit both the environment and the farming community.


​This activity supported in part by MnDRIVE Global Food Ventures, University of Minnesota
 

Relaunching GEMS Informatics Exchange APIs

Services
Written by
Kevin Silverstein and Phil Pardey

APIs: Now well-documented and much easier to use

One of the big frustrations in using computing to solve large, multidisciplinary challenges is managing data sets from different disciplines. Often, you have to go to each individual site and download the entire dataset. Then you have to parse out the subset of data fields you want within the geographies, spatial resolutions and time periods you care about. It is still the case that a few groups provide their data in the form of an Application Programmer Interface (API), where the data are served in a structured form with clear metadata documentation. Data can be sliced and diced how you like, selecting subsets of geography, time, and variables of interest. Once you sign up and obtain an API key, it just takes a few lines of code in Python or R to establish a connection and query at will!

GEMS has been building out a portfolio of APIs since 2021 across a range of useful datasets seeking to span the full Genetics x Environment x Management x Socioeconomic data landscape. Those who tried GEMS Exchange before will know that we used to have a middle layer managed by RapidAPI. Users found that cumbersome and confusing, so we are now using our own Apache APISIX server within our own web pages to serve you your key and monitor usage. We’re confident that your experience will be super easy this time around. Let’s get you started!

First, check out which APIs might interest you at our GEMS Exchange page. To obtain your API key simply click here for key. (Note you will need to have a Globus.org account, which is free – or you can connect via your academic institution, Google account, or ORCID). Once you know which APIs interest you, explore our collection of Jupyter notebooks in Github that give you practical guidance on how to use them. Many of the APIs we offer use the GEMS Grid which help ensure they are interoperable. And the GEMS Grid itself has recently been made open source, so you can place your own data sets on the Grid and interoperate with the community.

We are always happy to hear of useful datasets that could be added to the GEMS gridded collection in Exchange, so by all means reach out with suggestions or queries here.


​This activity supported in part by MnDRIVE Global Food Ventures, University of Minnesota

The GEMS Informatics Grid Goes Open Source

Written by
Kevin Silverstein

We are delighted to announce that we have just released the GEMS Grid code library, where the code is under the open source Apache 2.0 license, which allows anyone to use the code for commercial or non-commercial purposes – you simply need to provide attribution to GEMS Informatics when you use or modify it.

Just before we at GEMS Informatics started developing Application Programmer Interfaces (APIs) in agriculture for GEMS Exchange, GEMS geospatial expert Jeffery Thompson worked with others in the GEMS team and colleagues at NSIDC to develop the GEMS Grid, a hierarchical discrete global gridding system. This Grid has allowed us to provide data sets at different resolutions ranging from 36 km to 1 m, and still have them remain functionally interoperable. The interoperability is possible because we have written the code to allow users to project data onto the grid, aggregate data to coarser resolutions, and, notably, also disaggregate data to finer resolutions. The latter operation is ordinarily a difficult problem, but is made easier, as I discuss below, since we enable the users of our code to thoughtfully address it in a standardized, replicable way.

Many problems in agriculture (e.g., understanding the spatial location of crop production) require equal area parcels of land to do proper calculations. Working with strict lat-lon coordinates won’t suffice as areas near the equator are significantly different in size as areas near the poles. The GEMS Grid preserves equal-area assumptions as it divides land, so you can do these calculations with confidence, and preserve aggregation-disaggregation consistency in the data, even if you are not a GIS expert.

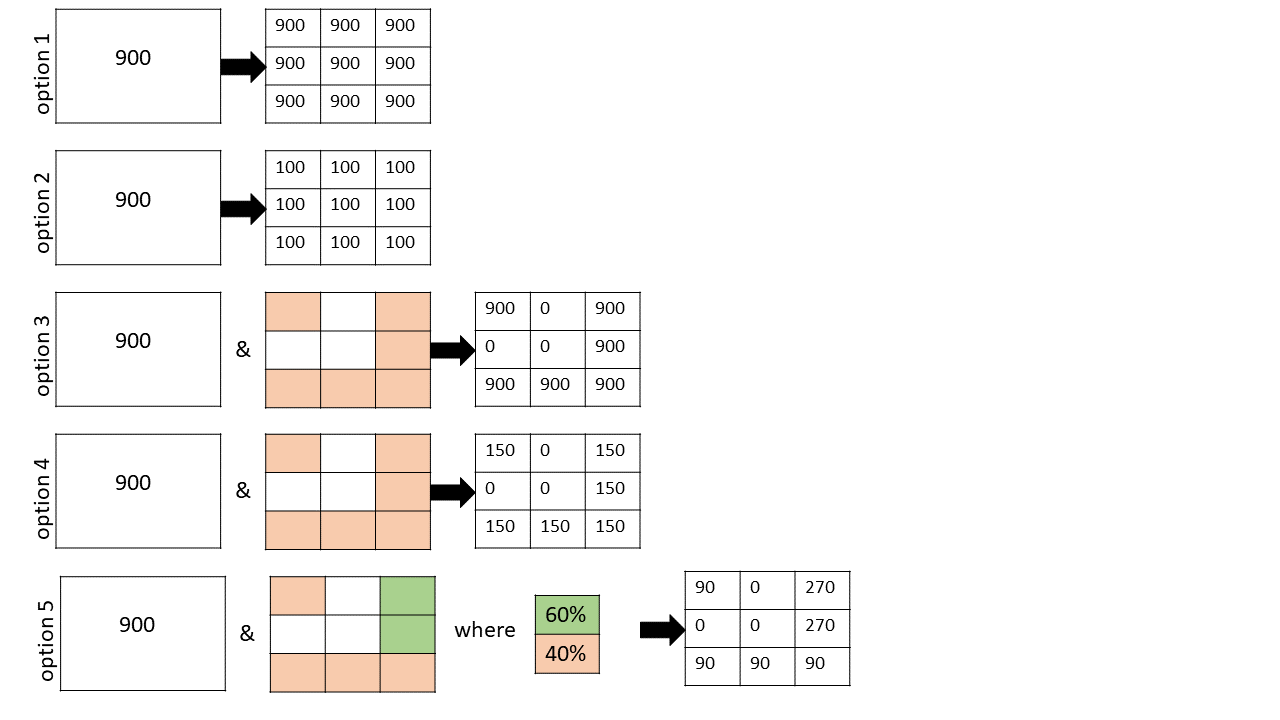
Pictorial description of the 5 options for disaggregation on the GEMS Grid

So let’s look at the 5 options for disaggregation that GEMS geospatial developer Olena Boiko included in the GEMS grid toolbox, schematically described in the figure she developed above.

Option 1. Value transference. 
In this case, if you were to subdivide a 3 km2 resolution grid cell into 9 x 1 km2 cells, this option would be appropriate for any value that is deemed roughly constant throughout the area applied. Examples would be rainfall in inches or grain yield in bushels / acre.

Option 2. Even value division. 
Sometimes the quantity measured in a cell represents a cumulative value for the area in which it is reported. In this case, if the parent cell is homogenous, then splitting it up into 9 equal-area pieces would require that you divide the value in each equivalent cell by a factor of 9. Examples where this selection makes sense include grain production in bushels, crop acreage, and population.

Option 3. Value transference with a mask. 
This one is similar to Option 1 except we are no longer making the assumption that the distribution of values in the parent cell is spatially homogeneous. For example suppose you were measuring grain yield, but you knew that 3 of your nine cells had buildings occupying them (see white areas in the Figure). In this case you only transfer your values to 6 remaining cells (colored peach) that have arable land. Cells are binary with this option (i.e., either allowed a value or not).

Option 4. Even value division with a mask. 
Analogously, you can mask out cells in the value division case when you know that your daughters cells are not all equal. This is just like the case in Option 3, except you divide your parent-cell value evenly by the number of viable daughter cells. In this pictorial example, there are 6 viable daughter cells, so each gets a value of 900/6 = 150. This would be appropriate if you were computing grain production in bushels and you had a total value that needed to be split up across the 6 arable daughter parcels.

Option 5. Flexible division with a mask. 
This scenario is the most flexible, and allows the user to create a master mask with arbitrary weights at each daughter cell. It allows you to block off daughter cells entirely, and prescribe the relative weights of all remaining daughter cells. This is ideal for situations where you are allocating crop distributions and you want to avoid certain land use features (e.g., lakes, forests, housing) and probabilistically distribute the remaining crop areas (e.g., with higher probability near soils with a high SSURGO National Commodity Crop Productivity Index).

I’m confident these flexible disaggregation tools will provide much easier, more accurate, and replicable solutions for your particular spatial analytic problem. So please give them a try!


​This activity supported in part by MnDRIVE Global Food Ventures, University of Minnesota

Water Resources and Sensing Conference Session

Written by
Kevin Silverstein

Assessing BMP Effectiveness for Water Quality Outcomes with Remote Sensing

Virtually everyone in Minnesota and bordering states whose profession has a direct stake in Water Conservation assembled in Downtown St. Paul’s RiverCentre October 17-18 for the annual Water Resources Conference. I had the honor of chairing a Special Session at the conference titled “Assessing BMP Effectiveness for Water Quality Outcomes with Remote Sensing.” The session featured two very foundational efforts that we are attempting to bridge together in partnered research at GEMS: (1) The Minnesota Department of Agriculture’s (MDA) Minnesota Agricultural Water Quality Certification Program (MAWQCP), directed by Brad Jordahl Redlin, and (2) the Department of Forest Resources’ remote-sensed Water Quality assessment for our 10,000+ lakes, led by Leif Olmanson.


The 90-minute session was organized so that each of the three speakers (one had dropped out last minute for logistical reasons) had 20 minutes to speak plus two minutes for burning questions. At the end the audience had 15 minutes for questions with the entire panel of speakers. There were about 30 very inquisitive people in the audience, who peppered the speakers with questions throughout.

Updates on the MDA’s certification program

Brad Jordahl Redlin kicked off the session with an outstanding talk that outlined the principles on which the certification program he founded and directs was created, and highlighted the progress that has been made. Literally over a million acres have now been certified, spread across over 1400 producers. In exchange for regulatory certainty for a period of time, these producers allow his government agency to (1) assess their farm practices, (2) suggest new management practices (sometimes with additional incentives such as subsidized equipment from a grant), and (3) carry out audits of their new practices. The program, which has been operational for nearly a decade, is well beyond the stage of corralling early-adopters. New participants span the spectrum of producer demographics in age, farm size, and more.
 

Brad Jordahl Redlin of the MDA talking at the WRC Special Session

Scaling lake quality measurement

Leif Olmanson stepped up to review an activity that he first spearheaded twenty years ago – using remote sensing to measure the water quality of Minnesota lakes. In the interim, he has overseen steady progress using new generations of satellites (from Landsat to Sentinel), multiple metrics (clarity, chlorophyll, organic matter), and the frequency of data reporting (from once every 5 years to ~weekly lake snapshot and monthly pixel-level composites of all 10,000+ lakes). Data is made available to the casual user via a friendly Lake Browser interface, and in numeric form pixel-by-pixel for data wizards on GEMS Exchange.
 

Leif Olmanson of the UMN Dept. of Forest Resources talking at the WRC Special Session

GEMS bridging the two programs

David Porter rounded out the session discussing the improvements he has made in creating algorithms that properly remove clouds and aerosols from the satellite images. This is a prerequisite for feeding all of the regularly spaced (~5 day) images of a field through a growing season into a sophisticated Recurrent Neural Network (RNN, a type of Machine Learning algorithm) that his colleague Anubha Agrawal has been preparing. As described in this case study, David, Anubha, and I intend to use the RNN trained on known, certified management practices (e.g., strip till / no till, cover crops) from the MAWQCP to make a prediction of what practices growers are making on uncertified farmland. We then will trace these producer fields to the downstream lakes in each watershed, and see what covariates (e.g., slope, soil type, distance to waterway) affect the correlation of % farm practice adoption vs. downstream lake quality in a watershed.


​This activity supported in part by MnDRIVE Global Food Ventures, University of Minnesota

Become a Data Scientist for Digital Agri

Services
Written by
Kevin A. T. Silverstein

What skills should you be building for a career as a data scientist in Digital Agriculture?

Everything we do has a spatial and temporal component. These days GIS skills are a big plus!

I often have students come to me saying “I’m passionate about the agri-food sector and I want to do data science. What skills do I need to land a satisfying job, and ultimately a career, in this area?” So I figured I’d take the opportunity to share what I typically say to them here, for the benefit of all those out there with similar goals and interests. Key items are in bold.

First off, there is so much unstructured data out there, in disparate formats and locations that you aren’t going to get far without a programming language under your belt. And in this field, that really boils down to Python and/or R. Sure, Chat-GPT can write code, but trust me, it’s not there yet.

Next, everything we do has a spatial and temporal component. These days GIS skills are a big plus! You don’t have to be a GIS expert, but you should know what a coordinate reference system and datum are, understand the limitations and practicalities of aggregation and disaggregation to different levels of resolution, and be facile with vector and raster manipulations.

Data science applied to any domain involves statistics and modeling. Moving beyond point estimates with p-values and understanding Bayesian statistics will get you far. And an understanding of databases (e.g., relational, graph, or columnar) can also be useful.

Finally, many datasets are incredibly large, so analyses often can’t be performed on your laptop. So familiarity with doing analyses on High-Performance Computing (HPC) infrastructure can be critical. These systems have mechanisms in place for you to schedule jobs to be run across multiple processors in tandem with other people’s jobs, and there are conventions and rules of etiquette for that.

Depending on the positions you have in your wish list, you may want to be sure to have either a Masters level degree or Ph.D. Masters should suffice if you’re happy to have someone else identify and devise the scope of the problems you work on. If you want to do pure R&D and define your own problems, a Ph.D. will likely be necessary.

If you're lacking some of these skills or qualifications, there are numerous data science degrees offered across the country, as well as short instructional modules such as those included in GEMS Learning.


​This activity supported in part by MnDRIVE Global Food Ventures, University of Minnesota