Pooling Ideas on Public-Private Agri-Food R&D and Innovation Possibilities: A World Food Prize Panel

Written by
Diana Horvath and Phil Pardey

2025 World Food Prize: Panel Summary


The global agri-food system is under unprecedented pressure from climate change and shifting economic landscapes. At a recent panel during the 2025 Borlaug Dialogue, leaders from the public and private sectors converged on a singular truth: the traditional R&D model must evolve into a more integrated, mutual value-driven ecosystem.  Read on for the speaker perspectives and short video clips of their discussion.

Speaker Perspectives: Bridging the Gap from Discovery to Impact

five panelists and panel moderator sitting in chairs with world food prize foundation fabric backdrop


1. The Shifting Geography of R&D


Phil Pardey | University of Minnesota (GEMS Informatics) Phil highlights a "seismic shift" in global agri-food R&D spending: middle-income countries now account for half of the world's agri-food R&D and the private sector role is becoming more prominent. However, low-income countries are being left behind, spending less than $1 on agri-food R&D for every $100 spent by the rest of the world. Phil calls for innovating the way we innovate and the benefits of partnerships where data and analytical tools are created and made accessible in IP- and market-aware ways that incentivize public and private investment while maintaining competitive value.

2. Beyond Core Crops: Cooperation & Community


Ty Vaughn | Bayer Crop Science Ty outlines Bayer’s "three-pronged" approach: Collaboration (working with groups like 2Blades), Cooperation (providing free IP and sequencing for crops like TR4-resistant bananas), and Market Enablement. He highlights a new $32M facility in Zambia that doesn't just process corn—it trains local workers and attracts secondary investments from partners like John Deere and Mastercard.

3. Purposefully Derisking Change


Ian Puddephat | PepsiCo Ian argues a resilient supply chain is impossible without a resilient farming community. He emphasizes that the real bottleneck isn’t just a lack of technology, but the transfer of knowledge required to apply it. He argues that the key to adoption is making change "easy" by sharing the journey of de-risking new technologies across the entire value chain.

4. Aligning Research with Actual Market Needs


Juan Lucas Restrepo | Alliance of Bioversity International and CIAT Juan Lucas discusses market-responsible collaboration, arguing for a sharper “ideation-to-deployment’ continuum where scientists develop solutions firmly rooted in actual market needs,  in addition to looking at "market pulls” such as shifting consumer habits or public policies to create a complementary dynamic between research in the public and  private sector, especially in the pre-competitive parts of the agri-food value chains.  

5. Bridging Gaps Through Aligned Interests


Diana Horvath | 2Blades Diana highlights that effective partnerships aren't just about "doing good"—they are about aligning incentive structures to create a win-win for everyone involved. By acknowledging that the private sector requires a return on investment while the public sector seeks social impact, 2Blades acts as a translational bridge. They facilitate models where private partners gain exclusive rights in their core markets while "carving out" and reserving those same technological benefits for smallholders in non-competing geographies. This "enlightened self-interest" ensures that every partner remains fully vested in the success of the project.


To hear more from these leaders in the Agri-food space, watch the entire panel discussion. 
Full length version of the panel discussion

WinterTurf hackathon and 2024–2025 sensing update

Categories
Written by
Ann Piotrowski, Majid Farhadloo, and Bryan Runck

As the WinterTurf 2024–2025 data collection season comes to a close, the WinterTurf sensing nodes are being removed to make way for spring maintenance and regular golf course operations. This winter marked our largest data collection effort yet, with 75 sensing nodes deployed across the northern hemisphere at golf courses and research sites. These nodes collected 702,905 data packets and 16,713,955 sensor readings, capturing the daily changes that influence turf health during the harshest months of the year.

By refining our technology and pursuing collaborative research, we aim to equip superintendents with the knowledge they need to protect and maintain their greens throughout the winter.

Technological advancements in WinterTurf sensing


This season, our team introduced sensing improvements to our data collection and sensor monitoring efforts. Our new Command Execution (CommandExe) support tool for our v3 data logger enables a remote command function to check connectivity and fine-tune functionality. Additionally, our updated dashboards provide real-time diagnostics, improving our daily monitoring capabilities.


With every season comes challenges. Some courses experienced poor cellular signal or quality, not allowing the node to send data in real time and limiting our remote access for diagnostics. To address this issue, our system is designed to store all data locally on an internal microSD card, which we can download once the node comes back to the lab in the spring. Another challenge in winter is the limited sunlight – our system relies on incoming solar energy with a battery backup. During the darkest months, some nodes still require manual battery charging by course superintendents, ensuring continued operation in very low-light conditions.


Exploring data through a multidisciplinary hackathon


Recently, we had an exciting two-day intensive hackathon event that included researchers, data scientists, and turfgrass experts. The meeting aimed to generate research questions and uncover patterns at a fast-paced tempo using our growing and extensive dataset. The group explored questions such as:


  • How do CO2 accumulation rates differ between these three cover conditions: ice, impermeable covers, and impermeable covers and ice (Figure 1)?
  • Which combination of fall practices correlates most strongly with reduced winterkill damage?
  • How do light intensity levels under different covers correlate with turfgrass recovery rates?


A bar graph showing weekly average CO2 levels under various winter turf cover types including impermeable covers and ice.

Figure 1. Exploratory bar graph showing weekly average CO2 levels under cover types: impermeable covers, ice, both ice and impermeable covers, or other cover type. Credit: Majid Farhadloo.


While the hackathon was mainly exploratory, it identified new directions for future research. The collaborative meeting highlighted the value of multidisciplinary analysis in understanding complex environmental data.


A banner image representing WinterTurf data collection efforts on golf courses across the northern hemisphere during winter.

A banner image representing WinterTurf data collection efforts on golf courses across the northern hemisphere during winter.


Final thoughts


Our goal remains the same: to provide golf course managers with research-based knowledge and tools for winter turf management. By refining our technology and pursuing collaborative research, we aim to equip superintendents with the knowledge they need to protect and maintain their greens throughout the winter. As we reflect on another successful season, we look forward to further advancements. Stay tuned for more updates as we continue to dig into the data.


​This activity supported in part by: MnDRIVE Global Food Ventures, University of Minnesota

Pedigree analysis tools illuminate ancestry of over 8.5M wheat varieties in CIMMYT’s international nursery

Categories
Written by
Kevin Silverstein

The International Wheat and Maize Improvement Center (CIMMYT) is the world’s primary source of breeding material for wheat and corn (maize). Founded in 1943 and vaulted to international recognition in the 1960’s and 70’s, partly through the work of U Minnesota alum and Nobel prize Laureate Norman Borlaug, CIMMYT was the original model for the centers that now comprise the CGIAR. Over the years, CIMMYT has accumulated a large database of pedigree, trait and passport information for millions of wheat genotypes that include finished varieties, germplasm accessions, and (advanced) breeding lines. This information is critical for breeding programs to track the inheritance of desired traits (e.g., yield, disease resistance, drought tolerance, baking quality) for selections that are made for subsequent generations. The coefficient of parentage (COP), also known as the inbreeding coefficient, is a particularly useful metric when considering any two genotypes as potential parents for breeding. Formally this quantity indicates the likelihood that for any gene, the copies that occur in both genotypes are descended from a common ancestor.


GEMS Informatics worked with CIMMYT to analyze a subset of their large database, the 2012-2024 spring and durum wheat international nursery dataset. This dataset included 8.5 Million genotypes, 11.8 Million genotype aliases (e.g., internal cross names, commercial release names, abbreviations), and 18 Million genotypic relationships. We set out to accomplish 3 tasks:


  1. Build a python code repository with a scalable infrastructure. GEMS Informatics designed an approach using SQLAlchemy and SQLite that can accommodate 100’s of millions of genotypes and their relationships. This effort was successful and took 6 months. All CIMMYT’s data can be ingested in just 1 hour on a contemporary laptop.
  2. Resolve naming discrepancies identified in the CIMMYT data. GEMS staff analyzed all common_name and cross_name designations among the 8.5 million genotypes and putatively identified 544 pairs of genotypes in CIMMYT’s genebank that may be duplicative, and hence require consolidation in their database. It is a testament to the care that CIMMYT staff have employed that there were only 544 “typos” among the names for these 8.5 million genotypes. Examples include common typographical errors (e.g., C0723595 and CO723595; II53.546 and 1153.546), punctuation variants (e.g., 4715D(5B) and 47-1-5D (5B); DARTS-IMPERIAL and DART´S IMPERIAL), compound word variants (e.g., PLAN ALTO and PLANALTO; YANG MAI 6 and YANGMAI 6), language variants (ALGERIAN and ALGERIEN; FEDERATION and FEDERACION) and misspellings (e.g., AEGILOP UMBELLULATA and ARGILOPS UMBELLULATA; ATALANTA and ATLANTA; AUBAKOMUGI and AOBAKOMUGHI).
  3. Provide harmonized pedigree datasets and query capabilities via an API to CIMMYT. All of the following questions can now be answered via API queries to the database: What are the parents of any wheat genotype? What are the pedigree entries at any arbitrary level? (level 1 = parents; level 2 = grandparents; level 3 = great grandparents; …) What is the full recursive pedigree for any genotype? (ideally traced back recursively to landraces, if possible) What are the known aliases for any wheat genotype? What is the matrix of pairwise COP values for any pair or list of genotypes?

Future Work

Cleaning and harmonizing wheat pedigrees worldwide. Previously PedTools, developed by GEMS in 2017 could support modest pedigree sizes involving thousands of genotypes, initially targeted to wheat pedigrees for US and Canadian varieties. This work enabled  the GEMS team to further enhance their PedTools infrastructure so that it can scale to collections with genotype counts numbering 10 million - 100 million. This makes it suitable to expand to CIMMYT’s full wheat genebanks as well as publicly accessible repos like GrainGenes and GRIN. Further, PedTools has the ability to match genotypes across organizations so it may serve to unify the wheat pedigree collections across countries, CIMMYT and public repositories, mapping accessions at each center to each other. 

Additional crops: The original incarnation of PedTools was used to harmonize ~10,000 soybean pedigrees for a UMN soybean breeding project. Our soybean breeding collaborator is currently digitizing decades of old printed variety breeding information. So we plan to revisit that harmonizing effort with the new version of PedTools. Soybean breeders don’t use the Purdey notation (variety 1 / variety 2 // variety 3) for pedigrees, but instead utilize an arithmetic notation (e.g., ((variety 1 x variety 2) x variety 3)). With this in mind the underlying architecture of PedTools has been designed to accommodate a plugin of any custom set of rules to parse variety names and pedigrees for specific crop communities. In this manner, in the future we can write a new parser to ingest a new format of pedigrees and the rest of the PedTools machinery remains unchanged since the internal representation of varieties and their relationships is the same. 
With this potential for expandability, we plan to engage pedigree data curators for other crops at various CGIAR Centers and elsewhere to help standardize their pedigrees and thus streamline and accelerate trait discovery and varietal development efforts.


Photo credit: A. Morgounov/CIMMYT.


Funding. The activities described here were conducted with support from the Government of Mexico and Minnesota State Government MnDRIVE funding made available to GEMS Informatics.


Cover Crop Monitoring with RGB-Based Indices: A Low-Cost Solution for Farmers

Categories
Written by
Ann Piotrowski

Cover crops provide many benefits such as improving soil health, sequestering carbon, and potentially providing nitrogen credits. Accurately measuring these benefits has traditionally required labor-intensive sampling, expensive instrumentation, and technical expertise.

Recent research in the Runck Lab by Rosen et al. (2024) investigates how consumer-grade cameras and RGB (Red-Green-Blue) imaging can offer a low-cost and scalable alternative for estimating cover crop biomass and biochemical composition. The findings suggest that common digital and smartphone cameras can provide good estimates of vegetative ground cover, nitrogen content, and carbon-to-nitrogen (C:N) ratios.

Using RGB Indices to Monitor Cover Crops

In this study, different RGB color indices were tested using off-the-shelf cameras on medium red clover (Trifolium pratense L.), a common cover crop, to classify vegetation pixels and estimate biomass The four indices included were Excess Green (ExG), Excess Green minus Red (ExGR), Green Leaf Index (GLI), and Visible Atmospherically Resistant Index (VARI). The ExGR index with a preset threshold of zero was the most effective at correctly identifying plant pixels from the background 86.25% of the time. The research findings also included strong correlations between plant canopy coverage and biomass (R² = 0.554, RMSE = 219.29 kg ha⁻¹), as well as between vegetation index values and nitrogen content (R² = 0.573, RMSE = 3.5 g kg⁻¹) and C:N ratio (R² = 0.574, RMSE = 1.29 g g⁻¹). This method remained stable across varying lighting conditions, making it practical for field applications.

Practical Applications and Future Potential

This study highlights the potential of RGB-based sensing to provide accurate estimates of biomass and nitrogen content. By integrating these indices into digital agriculture platforms or mobile applications, farmers and researchers could better manage soil health, use less fertilizers, and scale up research efforts with less specialized equipment.
While further validation across different crops and environments is needed, this approach represents a promising addition to the growing suite of precision agriculture tools. By using low-cost and widely available technology RGB-based indices have the potential to make data-driven farming more accessible and sustainable.

Acknowledgments

This work was funded by the United States Department of Agriculture, GEMS Informatics Center’s Real-time Geoinformation Systems Lab, and the University of Minnesota MnDRIVE Global Food Ventures Faculty Scholars program.

Photo Credit: Wikimedia Commons

A Prototype Tool for Integrating Agrometeorological Data Across Sources

Categories
Written by
Bryan C. Runck

As part of our ongoing work to improve the use of environmental data in agricultural research, we recently published a prototype tool that integrates multiple agrometeorological data sources into a unified access and querying system. This tool demonstrates how general-purpose extract-transform-load (ETL) systems can reduce overhead and improve data usability for digital agriculture workflows.

Researchers often spend a lot of time downloading, cleaning, and reformatting the same climate datasets from multiple providers. Each data source has its own format, API conventions, and spatial-temporal structures. Our prototype simplifies this by offering a standardized, open-source interface that harmonizes disparate sources and automates many of the most common processing tasks.

Man Typing on Computer with stats and graphs depicted


Built with extensibility and usability in mind, the system includes separate ETL managers for each dataset and supports spatial and temporal aggregation across user-defined parameters. Outputs can be downloaded as CSV or JSON, and users can access the tool through either a graphical user interface or a RESTful API. The system currently runs on Windows, Mac, and Linux and is designed to be lightweight and usable by researchers without extensive programming backgrounds.

We used Minnesota as the case study for this prototype. We were able to explore how researchers might customize queries for specific cropping systems, field experiments, or landscape-scale assessments. We believe this kind of data interface is especially important in the context of changing climates, where the ability to quickly assemble regionally and temporally relevant data can support adjustments to cropping calendars, irrigation schedules, and other time-sensitive decisions.

The project was supported by the Minnesota Environment and Natural Resources Trust Fund and the Legislative-Citizen Commission on Minnesota Resources. We hope this prototype serves not only as a useful tool for others but also as an example of how modular ETL architectures can be applied more broadly to agricultural and environmental research challenges.

The code is available under an open-source license


To see related activities by Bryan Runck, check out my Lab Page.


​This activity supported in part by MnDRIVE Global Food Ventures, University of Minnesota

Sensing Below-Ground Environments to Better Predict Potato Disease Threats

Written by
Senait D. Senay and Philip Pardey

Potatoes are a pervasive staple and specialty crop the world over, but so too are the pests and diseases that affect potato yields, tuber quality and farmer profitability. However, like the productive part of the crop itself, many potato diseases develop below ground, incurring costly damage well before the farmer becomes aware of the problem. Getting a better handle on the spatial extent, depth and temporal variation of soil temperature, moisture and other environmental variables that affect the development of potato diseases is key to modeling the field-scale risks posed by these threats. This is especially so if the aim is to model disease development in ways that provide farmers with actionable (real-time) information to mitigate or manage the crop production and profitability outcomes of these diseases.


Verticillium wilt is a long standing scourge of potato farmers. In related work, we estimate this particular soil borne fungi is a threat to almost 72% of the world’s potato growing area. V. wilt infections first become evident above ground when the plant’s lower leaves wither and die. Symptoms progress upwards until the entire plant yellows and wilts. The disease causes early senescence of the plant, which results in economically significant yield losses and tuber discoloration. In some instances, costly fumigation can be an effective mitigation strategy, while long rotations (3 years or more) with other crops can reduce the inoculum load of this long-lived disease at a particular site.

 
Creating fit-for-purpose biotic threat models that reveal the potential risks associated with V. wilt and other crop diseases at field scale and beyond is a core research focus of the GEMS Biotic Threat Analytics Lab. Pest risk prediction models and timely access to the targeted information products they enable helps farmers and others prioritize disease intervention on local (and neighboring) farms, informs a host of post-farm supply-chain decisions that rely on prospective crop production outcomes, feeds valuable information into early warning systems, and informs crop breeding strategies.

Digging Deeper into Above- and Below-Ground Environmental Data


Appropriately scaled environmental data both above and below ground data are required to informatively model the field-level risks posed by V. wilt (and other crop pests and diseases). While there are  several relevant gridded environmental datasets to hand, most are at coarser resolutions that extend well beyond the area extent of a typical potato field or farm. Moreover, these datasets often lack relevant below ground variables (e.g., soil moisture and temperature, at variable depths) that in combination with other variables are required to develop and deploy actionable pest prediction models of soil-born biotic threats. To rectify these two shortcomings, we turned to our GEMS Sensing team to provide real-time sensing of the needed environmental data. 
 

To best align our environmental sensing efforts with incidence and severity information on V. wilt, we also paired up with Dr. Ashish Ranjan’s Lab in the University of Minnesota’s (UMN) Department of Plant Pathology. Ashish conducts extensive V. wilt trials at UMN’s potato disease nursery located at the U’s Sand Plains Research Center in Becker, Minnesota. 


Siting Sensors to Reap the Biggest Predictive Bang for the Buck!


In 2023 we ran a test deployment of two GEMS sensing systems in the V. wilt resistance screening blocks at Becker, MN. Each system was configured with 3 above ground sensors (temperature, barometric pressure, and relative humidity) and 5 below ground sensors (soil moisture, temperature, permittivity, bulk soil electrical conductivity, and porosity). The above ground sensors were deployed in 3 replicates, and the below ground sensors at 3 depths. Our statistical assessment of these real-time data indicated that one set of above ground sensors coupled with below ground sensors at two depths yielded the optimal sensor configuration. 
 

GEMS Sensor, above ground sensing node


For the 2024 growing season we scaled up our sensing efforts to 17 sensing stations, each with 3 above ground sensors and 5 below ground sensors. Fifteen sensor systems were deployed in the research plots where select potato varieties are screened for V. wilt by the Ashish Lab, plus 2 sensing systems for benchmarking in the (disease free) potato breeding plots at Becker managed by Dr. Laura Shannon in UMN’s Department of Horticultural Science. 


The precise placement of each sensing system was informed by an environmental profiling exercise prior to field deployment. First we digitized the boundaries of each of the 16 blocks used in the V. wilt screening nursery then overlaid that on gridded data we accessed from GEMS Exchange on 10 variables of potential relevance for disease risk modeling; including elevation, slope, available water storage (AWS) and soil organic carbon stock estimate (both at 3 depths throughout the rootzone). Our aim was to sense as much environmental variation from within the study area as possible in the process of generating our targeted below (and above) ground environmental variables.
 

Gridded environmental data layers used to inform sensor deployment


The deployed location of each sensor is marked by the red dot in image #3, where in this instance each disease nursery block is overlaid on just one (i.e., elevation) of the 10 environmental variables we used to select a site for each sensor. 
 

Locations identified for sensor placement based on the environmental variability analysis work done on the study area.


The wealth of high-resolution, real-time (every 15 minutes) environmental data generated by this deployment is now being analyzed and integrated with correspondingly geo-tagged V wilt field data from the Ashish Lab. Field-scale predictive pest models are also being prototyped drawing directly on these novel, environment-linked-to-disease data sets to both develop and ground truth our modeling results. Working with our industry partners, PepsiCo, we look forward to further refining and then geographically scaling up the deployment of these predictive models to provide real-time, fit-for-purpose insights into dealing with this (and other) pesky potato diseases.     


Verticillium wilt Image credit: Utah State University


​This activity supported in part by MnDRIVE Global Food Ventures, University of Minnesota

Breeding Better Cassava for Climate Resilience

Categories
Written by
Thomas Kono, Sean Festemaker, Kevin Silverstein, Nathan Carlson, Phil Pardey

Cassava, a root crop, is a critical staple food crop planted on 32 million acres worldwide. It is widely grown throughout sub-Saharan Africa, notably in Nigeria, DR Congo, Ghana, Angola, and Mozambique, but with large acreages in Vietnam, Brazil, Indonesia and India. Besides being a critical source of calories and dietary fiber for many poorer households throughout Africa it is also a very versatile crop, serving as an important source of animal feed and starch with uses in foods, glues, biodegradable products and drugs. It has a global market value of $48.7 billion and is also a priority crop for the Vision for Adapted Crops and Soils (VACS) program, led by the U.S. State Department, which aims to create resilient food systems in Africa by growing nutritious, climate-adapted crops in healthy soils.

Unlocking Cassava’s Potential for Food Security and Climate Resilience

Conventional breeding is a painstaking laborious process that takes many crop generations to develop the first in a stream of varieties that adapt to ever-evolving market and climate conditions. To speed up this process, the International Center for Tropical Agriculture (CIAT) sequenced thousands of cassava varieties to reveal genetic markers of adaptive and harmful traits. GEMS colleagues Nathan Carlson, Tom Kono, and Kevin Silverstein in the Minnesota Supercomputing Institute (MSI), developed a queryable genomics database to enhance cassava breeding and improvement efforts at CIAT and elsewhere. To do so they drew on the whole genome resequencing data spanning 3,673 accessions of cassava provided by CIAT and identified short DNA sequence variants among them–totalying over 9 million sequence variants! More specifically, the MSI team identified nonsynonymous variants, a subset of the sequence variants that change the amino acid sequence of the plants’ proteins from the reference genome sequence. The functional impact of the nonsynonymous variants was then predicted using a sequence constraint model called BAD_Mutations (Chun and Fay 2009, Kono et al. 2018) to identify sequence variants with potential impact on cassava trait variation.

cassava root

Tackling Deleterious Mutations

CIAT breeders, led by Sean Fenstemaker, are excited at the possibilities these data provide for them. Deleterious mutations can significantly reduce crop yield and quality. CIAT’s breeding program now incorporates BAD_Mutations, an innovative SNP annotation tool designed to identify harmful genetic variants in cassava. This tool employs a likelihood ratio test based on alignments of publicly available angiosperm genomes, allowing for improved detection of deleterious mutations. 

Why Use BAD_Mutations?

Jonathon Newby, Cassava Program Leader, CIAT noted that  “While smallholder cassava farmers are faced with a range of new threats, there are also many untapped opportunities for this formerly neglected crop to address food security and nutrition,and still be a globally competitive product in industrial and food application. The cassava variant database addresses challenges and explores new opportunities for cassava breeding to unlock this potential. By comparing genetic variants with their ancestral origins, it provides insights into diversity and traits conserved in plants, aiding in the identification of key genetic variations. The database also supports molecular marker development, parent selection, and breeding strategy refinement.”

Enhancing Breeding Strategies

BAD_Mutations helps identify and select against genetic variants that negatively impact traits of interest. By using this tool, breeders can enhance phenotypic variation, leading to the development of robust and high-yielding cassava varieties. This genomic precision is vital for adapting to changing environmental conditions and meeting market demands. Additionally, breeders may use BAD_Mutations as a strategy for in silico validation of trait-linked markers, further ensuring the accuracy and effectiveness of molecular breeding efforts.

CIAT is using BAD_Mutations in tandem with other advanced technologies such as flower-inducing and doubled haploid techniques. These methods, combined with the University of Minnesota’s genomic tools, facilitate backcrossing-based trait introgression and systematic exploration of heterosis, significantly improving breeding efficiency of CIAT and its partners.

While cassava genetics was the focus of this project, the resulting queryable database framework has much broader applications within agriculture. Identification of genetic variants of potentially large effect is a technique that is useful for general crop and animal improvement, especially for complex traits (e.g., yield) which are typically under the influence of many genetic loci. Construction of an efficient, query-ready database allows for the genetic variation data to be rapidly assessed with standard input and output formats, making it easier for researchers to interpret the data.

This project demonstrates how cross-institution collaborations can accelerate applied research efforts. By partnering, CIAT and UMN crunched through a very large set of genomics data (requiring continuous compute cycles on hundreds of supercomputer processors for a month) into a format that can easily be used by geneticists and breeders to improve an important staple crop.

Global Collaboration for Food Security

These advanced genomic tools are pivotal in enhancing crop resilience and productivity by addressing the challenge of deleterious genetic mutations. CIAT invites researchers and global partners to collaborate in using this new cassava variant effect database. There is a real urgency to accelerate crop breeding to address global food security and poverty reduction concerns in the face of consequential changes in climate worldwide. Novel partnerships that pool complementary resources are key to making significant strides that result in timely and climate-resilient improvements in cassava and other crops.


​This activity supported in part by MnDRIVE Global Food Ventures, University of Minnesota
 

The GEMS Informatics Grid Goes Open Source

Written by
Kevin Silverstein

We are delighted to announce that we have just released the GEMS Grid code library, where the code is under the open source Apache 2.0 license, which allows anyone to use the code for commercial or non-commercial purposes – you simply need to provide attribution to GEMS Informatics when you use or modify it.

Just before we at GEMS Informatics started developing Application Programmer Interfaces (APIs) in agriculture for GEMS Exchange, GEMS geospatial expert Jeffery Thompson worked with others in the GEMS team and colleagues at NSIDC to develop the GEMS Grid, a hierarchical discrete global gridding system. This Grid has allowed us to provide data sets at different resolutions ranging from 36 km to 1 m, and still have them remain functionally interoperable. The interoperability is possible because we have written the code to allow users to project data onto the grid, aggregate data to coarser resolutions, and, notably, also disaggregate data to finer resolutions. The latter operation is ordinarily a difficult problem, but is made easier, as I discuss below, since we enable the users of our code to thoughtfully address it in a standardized, replicable way.

Many problems in agriculture (e.g., understanding the spatial location of crop production) require equal area parcels of land to do proper calculations. Working with strict lat-lon coordinates won’t suffice as areas near the equator are significantly different in size as areas near the poles. The GEMS Grid preserves equal-area assumptions as it divides land, so you can do these calculations with confidence, and preserve aggregation-disaggregation consistency in the data, even if you are not a GIS expert.

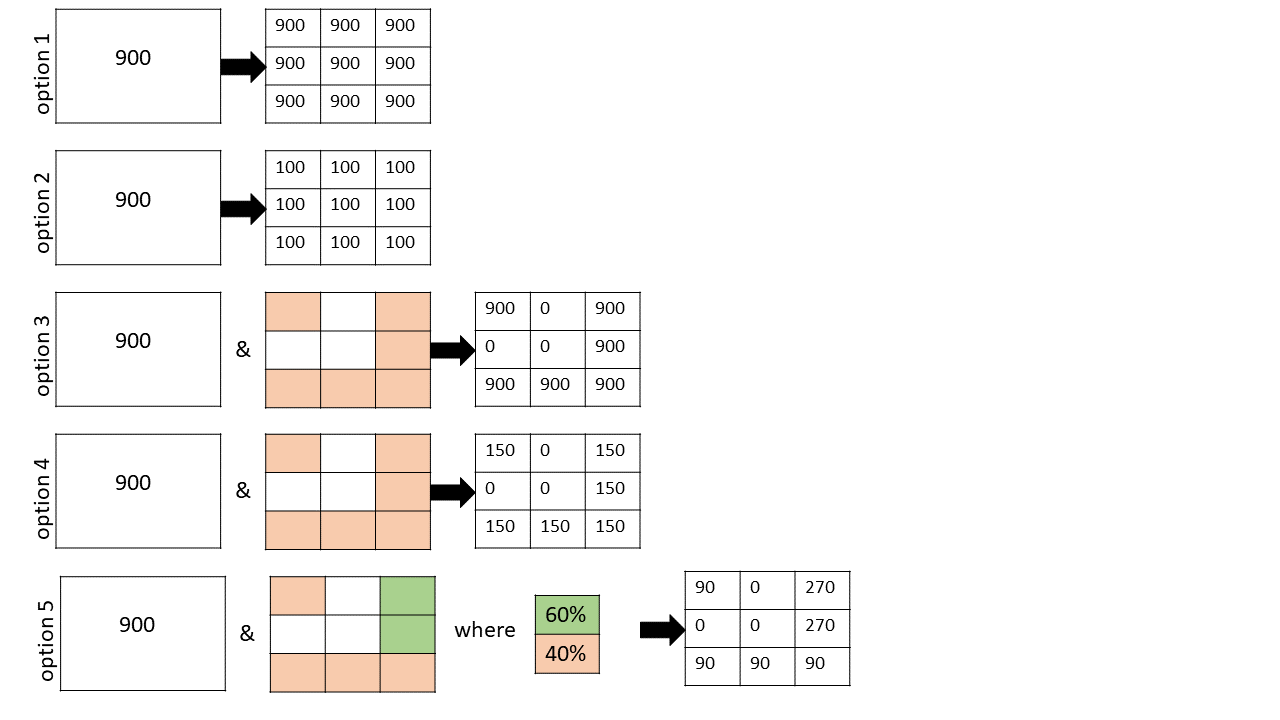
Pictorial description of the 5 options for disaggregation on the GEMS Grid

So let’s look at the 5 options for disaggregation that GEMS geospatial developer Olena Boiko included in the GEMS grid toolbox, schematically described in the figure she developed above.

Option 1. Value transference. 
In this case, if you were to subdivide a 3 km2 resolution grid cell into 9 x 1 km2 cells, this option would be appropriate for any value that is deemed roughly constant throughout the area applied. Examples would be rainfall in inches or grain yield in bushels / acre.

Option 2. Even value division. 
Sometimes the quantity measured in a cell represents a cumulative value for the area in which it is reported. In this case, if the parent cell is homogenous, then splitting it up into 9 equal-area pieces would require that you divide the value in each equivalent cell by a factor of 9. Examples where this selection makes sense include grain production in bushels, crop acreage, and population.

Option 3. Value transference with a mask. 
This one is similar to Option 1 except we are no longer making the assumption that the distribution of values in the parent cell is spatially homogeneous. For example suppose you were measuring grain yield, but you knew that 3 of your nine cells had buildings occupying them (see white areas in the Figure). In this case you only transfer your values to 6 remaining cells (colored peach) that have arable land. Cells are binary with this option (i.e., either allowed a value or not).

Option 4. Even value division with a mask. 
Analogously, you can mask out cells in the value division case when you know that your daughters cells are not all equal. This is just like the case in Option 3, except you divide your parent-cell value evenly by the number of viable daughter cells. In this pictorial example, there are 6 viable daughter cells, so each gets a value of 900/6 = 150. This would be appropriate if you were computing grain production in bushels and you had a total value that needed to be split up across the 6 arable daughter parcels.

Option 5. Flexible division with a mask. 
This scenario is the most flexible, and allows the user to create a master mask with arbitrary weights at each daughter cell. It allows you to block off daughter cells entirely, and prescribe the relative weights of all remaining daughter cells. This is ideal for situations where you are allocating crop distributions and you want to avoid certain land use features (e.g., lakes, forests, housing) and probabilistically distribute the remaining crop areas (e.g., with higher probability near soils with a high SSURGO National Commodity Crop Productivity Index).

I’m confident these flexible disaggregation tools will provide much easier, more accurate, and replicable solutions for your particular spatial analytic problem. So please give them a try!


​This activity supported in part by MnDRIVE Global Food Ventures, University of Minnesota

Research Working Towards Big Data Analysis

Written by
Jesse Erdmann

Researchers that are transitioning from doing analysis locally on their laptop to remote or large scale analysis often fall into a few common traps. Moving from local analysis isn’t necessarily difficult, but there are some good habits to develop that will make your transition more productive.

Establish a small test set

The set should be representative of the variety of data in the full data set if possible, but doesn’t necessarily need to produce results similar to that of the full analysis. There are two key wins that come from having a small test set predefined.

Development loop speed 

There is a temptation, especially for those who are used to working on smaller datasets, to write code and then run it against the complete dataset. However, code is almost never perfect on the first, second, or even third attempt.  If running a test takes several minutes or more that can force you to focus your attention elsewhere while you wait, reducing your efficiency and causing even longer delays. It is best to have a small, even if nonsensical, test set that can run in 10 seconds or less. Rapid iteration is key, especially during early development phases.

Validating changes before large runs

The point of this set is to establish a set of unit tests that exercise the code which can be used to verify core functionality. There is little worse than starting a long running task, getting most of the way through the task, and then encountering an error due to a typo or other simple oversight that requires starting the process over again. Having tests that check for basic functionality at the edges of expected input will save a lot of time by preventing waiting for executions that can never successfully complete.

Additionally, as new errors are encountered based on real data make sure to extend both the code and the tests to appropriately handle the new cases that were improperly handled.  This does not necessarily mean to solve data problems during execution, but when faults or exceptions occur due to type errors, etc, catch the error and log it in a way that can be presented to the user as part of a list of data cleaning tasks to perform before the next attempt. In a large dataset, only returning the first encountered error is a sure way to make the task take far too long. Instead, log each case as they are encountered, while ensuring that the program keeps going all of the way to the end generating an easy-to-understand error log.

Execution environment

One of the keys to ensuring reproducible behavior is tracking which external libraries are used in a program and more specifically which versions. In modern software development we are very dependent on others and their contributions to make our own development processes tractable. As with everything there are pros and cons to the way software is currently being developed. Further challenges and opportunities will arise as AI generated code, or AI assisted development becomes more common.

For now, ensure familiarity with the concept of semantic versioning. In brief, the first number is the major version, the next version is the minor version, and the third version is the patch version. For most purposes, when setting up an execution environment a good rule of thumb is to use the minor version of a library as the one to base an environment on. This should allow for fixes to be applied at the patch level, but more substantive changes can be adopted as needed.

Required libraries

In this case, required libraries only refer to the libraries that are directly imported and invoked by the code under development. Each required library may also include subsequent libraries, but trying to enumerate these or their versions will make building an execution environment much more challenging. The tradeoff is that these dependencies of dependencies can introduce unexpected changes.  

Packaging systems

Once a requirements list has been established, most programming environments have tools that can be used to create an environment that includes the contents of the requirements list. In Python, this can be achieved with the pip command. However, it is important to note that some libraries will be C or C++ based and require an appropriate compiler to build.

This is where a tool like conda comes into play. Where a tool like pip will install dependencies from their source code, conda maintains repositories with prebuilt binaries instead. Conda also supports multiple languages. The tradeoff is that conda adds a significant amount of disk usage to an environment.

If the intent is to rebuild an environment on every system where the code will be executed this is not much of a problem. If, however, ensuring the exact same version of required libraries are available and the environment itself will be packaged for distribution the additional gigabytes of storage can be more of a disadvantage. 

Container Images w/Docker, Apptainer, or Kubernetes

Over the last decade Docker images and other container infrastructure providers have become more popular as a way to provide a lightweight way to build a frozen, all inclusive, execution environment. This allows a researcher to deploy an identical execution environment and code from their laptop to a High Performance Computing or Cloud Computing environment.

Many CyberInfratructure providers such as the Minnesota Supercomputing Institute and the NSF’s ACCESS provide facilities for running containers from provided images using Apptainer. In cloud computing Kubernetes or other tools might be more readily available. 
 

Putting it all together

With some planning, a researcher could develop a good test suite to ensure that their code produces expected results, create a reproducible environment to the degree of their choice, and get the best of both rapid development locally using a minimal data set as well as the ability to then run the full data set on appropriately scaled hardware elsewhere. Each case will have unique circumstances that are difficult to provide a standard solution for. However, hopefully this introduction to some of the possibilities will help researchers choose a path that will help them develop a robust approach to working with big data.


​This activity supported in part by MnDRIVE Global Food Ventures, University of Minnesota

Innovation in Assessing Soybean Aphid Risk

Written by
Yuan Chai

We’re thrilled to announce that GEMS is leading a novel 2-year project funded by the Minnesota Invasive Terrestrial Plants and Pests Center (MITPPC) with support from the Minnesota Environment and Natural Resources Trust Fund.  "Linking soybean aphid losses to technology investment decisions"  a transformative project aimed at developing a flexible, evidence-based, bio-economic evaluation workflow to characterize the long-term, probabilistic extent of soybean aphid damage throughout Minnesota.

Our Mission: A Repeatable and Extensible Pest Risk Assessment Tool to Inform Decision Making

Soybean aphids have emerged as a significant arthropod pest impacting soybeans in North America since 2000. However, a systematic effort to collect, analyze, and report on yield losses caused by this pest in farmers' fields has been notably absent, particularly concerning the longer-term, state-wide perspectives that are crucial for strategic R&D and policy decisions.

Our goal is to comprehensively assess the risk posed by the soybean aphid for the state of Minnesota to help inform decisions regarding research investment and pest mitigation strategies. Our evaluation framework breaks new ground by factoring in both the spatially- and temporally-variable pest risk elements that many prior efforts have overlooked. Our flexible evaluation approach is designed to deal with either data-poor or data-rich scenarios while taking into account the geographical extent, frequency, and severity of damage to undertake regional and meso-scale risk assessments. 

Our project, 'Linking Soybean Aphid Losses to Technology Investment Decisions,' is breaking new ground by developing a flexible, evidence-based framework for estimating crop losses that account for the dynamic nature of pest risks. Through interdisciplinary collaboration, we're forging a path to innovative solutions in agriculture.

-Yuan Chai

Forward-Looking Impact: Shaping Tomorrow's Risk Management Strategies

This project entails close collaboration between the GEMS Informatics Center (PI Dr. Philip Pardey and co-PI Dr. Yuan Chai) and the Department of Entomology (co-PI Dr. Robert Koch), leveraging a spectrum of expertise in pest, crop, and socio-economics. With cutting-edge data and analytics support, we're developing a data-driven, replicable, and extensible framework for meso-scale ex-ante pest risk evaluation of soybean aphids. The project's impact stretches far beyond the laboratory, resonating with stakeholders invested in the field of crop pest management. Our findings will empower MITPPC, state government agencies, academic units, and crop commodity groups to strategically allocate resources for targeted investments in pest management strategies. Moreover, our approach is designed to be extendable to a wide range of crop pest and disease challenges in Minnesota and beyond.

Join Us on this Journey! 

Join us on this transformative journey, where our collaborative effort is poised to shape the future of agricultural resilience and resource optimization decisions. Stay tuned for updates on findings, methodologies, and the broader implications of our work by signing up for the MITPPC newsletter and by visiting our project page. Together, let's revolutionize the landscape of agricultural research and pest management! ??


Photo Attribution: Christina DiFonzo, Michigan State University / © Bugwood.org


​This activity supported in part by MnDRIVE Global Food Ventures, University of Minnesota