As part of our ongoing work to improve the use of environmental data in agricultural research, we recently published a prototype tool that integrates multiple agrometeorological data sources into a unified access and querying system. This tool demonstrates how general-purpose extract-transform-load (ETL) systems can reduce overhead and improve data usability for digital agriculture workflows.
Researchers often spend a lot of time downloading, cleaning, and reformatting the same climate datasets from multiple providers. Each data source has its own format, API conventions, and spatial-temporal structures. Our prototype simplifies this by offering a standardized, open-source interface that harmonizes disparate sources and automates many of the most common processing tasks.
Built with extensibility and usability in mind, the system includes separate ETL managers for each dataset and supports spatial and temporal aggregation across user-defined parameters. Outputs can be downloaded as CSV or JSON, and users can access the tool through either a graphical user interface or a RESTful API. The system currently runs on Windows, Mac, and Linux and is designed to be lightweight and usable by researchers without extensive programming backgrounds.
We used Minnesota as the case study for this prototype. We were able to explore how researchers might customize queries for specific cropping systems, field experiments, or landscape-scale assessments. We believe this kind of data interface is especially important in the context of changing climates, where the ability to quickly assemble regionally and temporally relevant data can support adjustments to cropping calendars, irrigation schedules, and other time-sensitive decisions.
The project was supported by the Minnesota Environment and Natural Resources Trust Fund and the Legislative-Citizen Commission on Minnesota Resources. We hope this prototype serves not only as a useful tool for others but also as an example of how modular ETL architectures can be applied more broadly to agricultural and environmental research challenges.
In recent years, the fusion of artificial intelligence (AI), machine learning (ML), and the Internet of Things (IoT) has opened up unprecedented opportunities for agricultural innovation. One groundbreaking development in this arena is the implementation of real-time geoinformation systems, which promise to revolutionize agri-environment research by enhancing data quality, scalability, and cost-efficiency.
The Rise of Spatial IoT in Agriculture
As the agricultural sector increasingly relies on AI and ML for knowledge discovery, the need for large, high-quality datasets has become paramount. Spatial IoT technologies, which involve deploying internet-connected sensors throughout agricultural environments, have emerged as a crucial tool in this data-driven landscape. These sensors collect real-time, high-resolution geospatial and temporal data, enabling researchers to monitor and analyze agricultural systems with unprecedented precision.
Challenges in IoT Implementation
Despite its potential, the implementation of IoT in agriculture presents significant challenges. Managing large fleets of devices while maintaining data quality is a complex task. Scientists often start with one-off prototypes, but scaling these to thousands of internet-connected devices requires overcoming numerous technical and logistical hurdles.
Case Studies in IoT System Development
The University of Minnesota’s Real-Time GeoInformation Systems Lab has been at the forefront of addressing these challenges. Since 2019, the lab has developed and deployed over 2,727 IoT devices across four continents. This extensive deployment has provided valuable insights into creating a generalizable, open-source spatial IoT system tailored for agricultural research. This work was summarized in a recent pre-print on Arxiv.com (Runck et al. 2024). One key aspect of the lab's work has been the iterative development of the IoT system, progressing through three major and fourteen minor versions. Each iteration has refined the system's capabilities, from improving sensor accuracy to enhancing data transmission reliability. The current version of the system is designed to be scalable, ensuring that it can be deployed widely while maintaining high data quality.
Practical Applications
The applications of these IoT systems are diverse and impactful. For instance, in irrigation management, real-time data on soil moisture and temperature help optimize water usage, crucial in regions facing water scarcity. Similarly, in plant winterkill research, sensors monitor microclimates to understand the conditions leading to crop damage in cold environments. These insights enable farmers to adopt preventive measures, safeguarding crop yields. Another notable application is in meteorological observations. Deploying IoT systems for weather monitoring provides granular data that enhance the accuracy of weather forecasts, which is vital for agricultural planning and risk management. For example, in Minnesota and Malawi, extensive networks of weather stations equipped with IoT sensors collect data that support both local farmers and broader agricultural research initiatives. However, paying attention to data quality, access and interoperability matters, often coupled with fit-for-purpose analytic pipelines, is key to ensuring real-time, geo-sensed data lead to actionable, data-driven informatics products.
The Role of Open Source in Scaling IoT
Open-source technology plays a crucial role in the scalability of IoT systems. By making design files and code publicly available, researchers can build on existing work, ensuring broader adoption and continuous improvement. This collaborative approach aligns with the scientific principles of transparency and reproducibility, fostering innovation across the agricultural research community.
Moving Forward: GEMS Sensing Service
To support the ongoing development and deployment of IoT systems, the University of Minnesota has established GEMS Sensing, a service organization within its GEMS Informatics Center. This initiative aims to provide turnkey IoT solutions for researchers, ensuring that the technology is accessible and sustainable. By offering both internal and external sales models, GEMS Sensing facilitates public-private partnerships, driving further advancements in digital agriculture.
Conclusion
The integration of real-time geoinformation systems into agricultural research marks a significant leap towards smarter, more sustainable farming practices. By harnessing the power of spatial IoT, researchers can collect and analyze data at an unprecedented scale and resolution, paving the way for innovative solutions to some of agriculture's most pressing challenges. As these technologies continue to evolve, the future of agriculture looks increasingly data-driven and resilient, promising enhanced productivity and sustainability for the global food system.
Image: Generated with Firefly. of A modern agricultural field with IoT sensors placed at various points.
This activity supported in part by MnDRIVE Global Food Ventures, University of Minnesota
Fertilizers are essential for boosting crop yields and increasing farm productivity. However, excessive use of fertilizers not only incurs high costs for farmers but also leads to harmful runoff that pollutes waterways. To address these challenges, GEMS Informatics is collaborating with the Minnesota Department of Agriculture’sWater Quality Certification Program and colleagues from the University of Minnesota. Together, they are leveraging AI and data science, in combination with ground-truth and remote-sensed data, to inform farmers of best management practices and track the water quality outcomes of those practices at scale.
The Problem with Over-Fertilization
While fertilizers play a crucial role in modern farming, their overuse can be detrimental. Excess fertilizers often wash into nearby water bodies, causing environmental pollution and financial waste for farmers. The key to effective fertilizer management lies in precise measurement and informed decision-making.
Harnessing Data for Sustainable Practices
Brad Jordahl Redlin, Water Quality Certification Program Manager at the Minnesota Department of Agriculture, emphasizes the importance of GEMS Informatics' work: “GEMS is building the analytical backend, linking farmer fields to watersheds and monitoring ongoing water quality. This will enable us to measure the positive effects of our certification program.”
Kevin Silverstein, Operations Manager at GEMS Informatics, adds: “We use satellite imagery to support government policy. Partnering with the Department of Agriculture, we train machine learning programs to recognize sustainable practices like strip-till or no-till farming, and cover crops and buffer strips that prevent water runoff. We can then correlate these practices with their impact on water quality and provide recommendations to the certification program.”
Advanced Monitoring with Satellite Technology
In collaboration with CFANS colleague and remote sensing water quality expertLeif Olmanson, GEMS Informatics employs satellite technology and supercomputers to monitor water quality. Monthly averages of satellite signals provide comprehensive measurements across Minnesota’s lakes, even those seldom exposed to direct sunlight.
Machine learning algorithms developed by GEMS require regular, unobstructed satellite signals. To ensure accuracy, GEMS imputes missing data using adjacent pixels in time and space. This approach turns vast amounts of data into actionable insights, empowering policymakers and farmers while safeguarding privacy.
Jim Wilgenbusch, Director of Research Computing at the University of Minnesota, praises GEMS Informatics' innovative approach: “It’s extremely exciting that they push at the boundaries of what researchers traditionally considered possible. GEMS sits at the intersection of a database where you store, catalog, and organize information, and modeling that information on a massive scale. It has huge potential to support researchers in their work at the cutting edge.”
By combining AI, data science, and collaborative efforts, GEMS Informatics is paving the way for sustainable farming practices that benefit both the environment and the farming community.
One of the big frustrations in using computing to solve large, multidisciplinary challenges is managing data sets from different disciplines. Often, you have to go to each individual site and download the entire dataset. Then you have to parse out the subset of data fields you want within the geographies, spatial resolutions and time periods you care about. It is still the case that a few groups provide their data in the form of an Application Programmer Interface (API), where the data are served in a structured form with clear metadata documentation. Data can be sliced and diced how you like, selecting subsets of geography, time, and variables of interest. Once you sign up and obtain an API key, it just takes a few lines of code in Python or R to establish a connection and query at will!
GEMS has been building out a portfolio of APIs since 2021 across a range of useful datasets seeking to span the full Genetics x Environment x Management x Socioeconomic data landscape. Those who tried GEMS Exchange before will know that we used to have a middle layer managed by RapidAPI. Users found that cumbersome and confusing, so we are now using our own Apache APISIX server within our own web pages to serve you your key and monitor usage. We’re confident that your experience will be super easy this time around. Let’s get you started!
First, check out which APIs might interest you at our GEMS Exchange page. To obtain your API key simply click here for key. (Note you will need to have a Globus.org account, which is free – or you can connect via your academic institution, Google account, or ORCID). Once you know which APIs interest you, explore our collection of Jupyter notebooks in Github that give you practical guidance on how to use them. Many of the APIs we offer use the GEMS Grid which help ensure they are interoperable. And the GEMS Grid itself has recently been made open source, so you can place your own data sets on the Grid and interoperate with the community.
We are always happy to hear of useful datasets that could be added to the GEMS gridded collection in Exchange, so by all means reach out with suggestions or queries here.
We are delighted to announce that we have just released the GEMS Grid code library, where the code is under the open source Apache 2.0 license, which allows anyone to use the code for commercial or non-commercial purposes – you simply need to provide attribution to GEMS Informatics when you use or modify it.
Just before we at GEMS Informatics started developing Application Programmer Interfaces (APIs) in agriculture for GEMS Exchange, GEMS geospatial expert Jeffery Thompson worked with others in the GEMS team and colleagues at NSIDC to develop the GEMS Grid, a hierarchical discrete global gridding system. This Grid has allowed us to provide data sets at different resolutions ranging from 36 km to 1 m, and still have them remain functionally interoperable. The interoperability is possible because we have written the code to allow users to project data onto the grid, aggregate data to coarser resolutions, and, notably, also disaggregate data to finer resolutions. The latter operation is ordinarily a difficult problem, but is made easier, as I discuss below, since we enable the users of our code to thoughtfully address it in a standardized, replicable way.
Many problems in agriculture (e.g., understanding the spatial location of crop production) require equal area parcels of land to do proper calculations. Working with strict lat-lon coordinates won’t suffice as areas near the equator are significantly different in size as areas near the poles. The GEMS Grid preserves equal-area assumptions as it divides land, so you can do these calculations with confidence, and preserve aggregation-disaggregation consistency in the data, even if you are not a GIS expert.
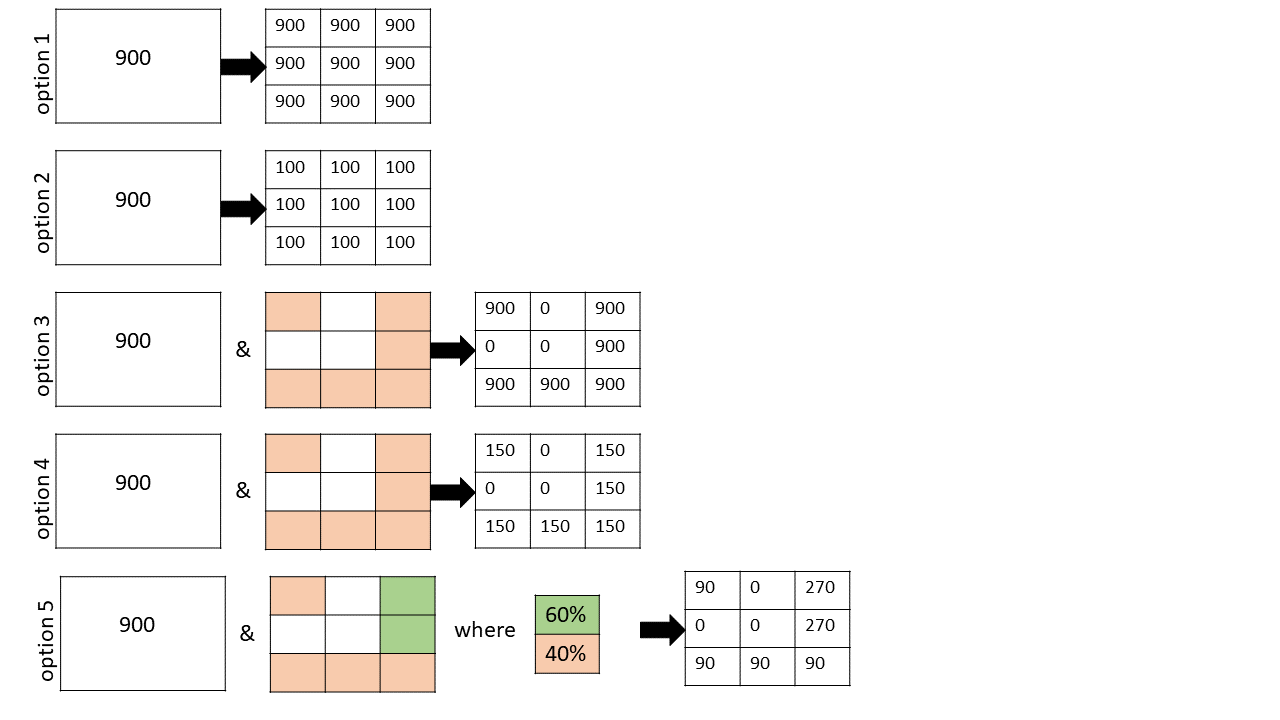
So let’s look at the 5 options for disaggregation that GEMS geospatial developer Olena Boiko included in the GEMS grid toolbox, schematically described in the figure she developed above.
Option 1. Value transference. In this case, if you were to subdivide a 3 km2 resolution grid cell into 9 x 1 km2 cells, this option would be appropriate for any value that is deemed roughly constant throughout the area applied. Examples would be rainfall in inches or grain yield in bushels / acre.
Option 2. Even value division. Sometimes the quantity measured in a cell represents a cumulative value for the area in which it is reported. In this case, if the parent cell is homogenous, then splitting it up into 9 equal-area pieces would require that you divide the value in each equivalent cell by a factor of 9. Examples where this selection makes sense include grain production in bushels, crop acreage, and population.
Option 3. Value transference with a mask. This one is similar to Option 1 except we are no longer making the assumption that the distribution of values in the parent cell is spatially homogeneous. For example suppose you were measuring grain yield, but you knew that 3 of your nine cells had buildings occupying them (see white areas in the Figure). In this case you only transfer your values to 6 remaining cells (colored peach) that have arable land. Cells are binary with this option (i.e., either allowed a value or not).
Option 4. Even value division with a mask. Analogously, you can mask out cells in the value division case when you know that your daughters cells are not all equal. This is just like the case in Option 3, except you divide your parent-cell value evenly by the number of viable daughter cells. In this pictorial example, there are 6 viable daughter cells, so each gets a value of 900/6 = 150. This would be appropriate if you were computing grain production in bushels and you had a total value that needed to be split up across the 6 arable daughter parcels.
Option 5. Flexible division with a mask. This scenario is the most flexible, and allows the user to create a master mask with arbitrary weights at each daughter cell. It allows you to block off daughter cells entirely, and prescribe the relative weights of all remaining daughter cells. This is ideal for situations where you are allocating crop distributions and you want to avoid certain land use features (e.g., lakes, forests, housing) and probabilistically distribute the remaining crop areas (e.g., with higher probability near soils with a high SSURGO National Commodity Crop Productivity Index).
I’m confident these flexible disaggregation tools will provide much easier, more accurate, and replicable solutions for your particular spatial analytic problem. So please give them a try!
Assessing BMP Effectiveness for Water Quality Outcomes with Remote Sensing
Virtually everyone in Minnesota and bordering states whose profession has a direct stake in Water Conservation assembled in Downtown St. Paul’s RiverCentre October 17-18 for the annual Water Resources Conference. I had the honor of chairing a Special Session at the conference titled “Assessing BMP Effectiveness for Water Quality Outcomes with Remote Sensing.” The session featured two very foundational efforts that we are attempting to bridge together in partnered research at GEMS: (1) The Minnesota Department of Agriculture’s (MDA) Minnesota Agricultural Water Quality Certification Program (MAWQCP), directed by Brad Jordahl Redlin, and (2) the Department of Forest Resources’ remote-sensed Water Quality assessment for our 10,000+ lakes, led by Leif Olmanson.
The 90-minute session was organized so that each of the three speakers (one had dropped out last minute for logistical reasons) had 20 minutes to speak plus two minutes for burning questions. At the end the audience had 15 minutes for questions with the entire panel of speakers. There were about 30 very inquisitive people in the audience, who peppered the speakers with questions throughout.
Updates on the MDA’s certification program
Brad Jordahl Redlin kicked off the session with an outstanding talk that outlined the principles on which the certification program he founded and directs was created, and highlighted the progress that has been made. Literally over a million acres have now been certified, spread across over 1400 producers. In exchange for regulatory certainty for a period of time, these producers allow his government agency to (1) assess their farm practices, (2) suggest new management practices (sometimes with additional incentives such as subsidized equipment from a grant), and (3) carry out audits of their new practices. The program, which has been operational for nearly a decade, is well beyond the stage of corralling early-adopters. New participants span the spectrum of producer demographics in age, farm size, and more.
Scaling lake quality measurement
Leif Olmanson stepped up to review an activity that he first spearheaded twenty years ago – using remote sensing to measure the water quality of Minnesota lakes. In the interim, he has overseen steady progress using new generations of satellites (from Landsat to Sentinel), multiple metrics (clarity, chlorophyll, organic matter), and the frequency of data reporting (from once every 5 years to ~weekly lake snapshot and monthly pixel-level composites of all 10,000+ lakes). Data is made available to the casual user via a friendly Lake Browser interface, and in numeric form pixel-by-pixel for data wizards on GEMS Exchange.
GEMS bridging the two programs
David Porter rounded out the session discussing the improvements he has made in creating algorithms that properly remove clouds and aerosols from the satellite images. This is a prerequisite for feeding all of the regularly spaced (~5 day) images of a field through a growing season into a sophisticated Recurrent Neural Network (RNN, a type of Machine Learning algorithm) that his colleague Anubha Agrawal has been preparing. As described in this case study, David, Anubha, and I intend to use the RNN trained on known, certified management practices (e.g., strip till / no till, cover crops) from the MAWQCP to make a prediction of what practices growers are making on uncertified farmland. We then will trace these producer fields to the downstream lakes in each watershed, and see what covariates (e.g., slope, soil type, distance to waterway) affect the correlation of % farm practice adoption vs. downstream lake quality in a watershed.
Making Sense of Agriculture from Minnesota to Malawi
GEMS Sensing has coupled world-class engineering design and build expertise with first-rate agricultural science smarts to realize a robust, extensible sensing system for agri-food research anywhere in the world.
Since early 2020, GEMS Sensing has partnered with the Centre for Agricultural Transformation(CAT) in Malawi to pilot the local deployment of GEMS research-grade weather stations and its associated data visualization and sharing tool. Piloting a network of weather stations across Malawi involves much more than working through the logistics of manufacturing, delivering and deploying the necessary hardware and software. It also involves identifying partners willing to trial the weather stations on their research stations/farms and training local CAT personnel to enable the deployment, particularly in remote rural areas with uncertain cellular connectivity. Working through the CAT provides a unique opportunity to engage with private and public agribusiness throughout Malawi to test GEMS Sensing technologies in a low-income, smallholder farmer, tropical environment.
GEMS weather stations across Malawi
Over the past five years, the GEMS Sensing team has used feedback from our field partners to develop ever-improving scientific-grade, plug-and-play sensing devices coupled with a secure web-based informatics service. Weather stations aren’t new, but GEMS Sensing has created a highly customizable system that is built specifically for the varied sensing needs of researchers and their collaborators. The system's core logger box can be used for scientists with vastly different sensing requirements, from a full-stack meteorological station supporting a host of on-station or in-field crop performance studies to more specialized applications aimed at monitoring the below ground conditions that affect plant growth and health. The system's configurable and easy-to-use dashboard enables the integration, exploration, and sharing of real-time sensor data from multiple, perhaps distant, sites through a single portal.
Tracking the real-time, micro-level weather and edaphic patterns impacting agricultural production is crucial for a whole host of reasons, including advancements in breeding, agronomy, and extension efforts and the livelihoods of the farmers responsible for this production. These types of data are used for modeling weather events over large areas (e.g., rainfall and temperature) or informing management decisions like when and how much to irrigate a crop. However, being able to collect, store, clean, explore, share, and analyze these data from multiple sites, isn’t always straightforward. With this motivation in mind, the team has coupled world-class engineering design and build expertise with first-rate agricultural science smarts to realize a robust, extensible sensing system for agri-food research anywhere in the world.
GEMS Sensing in sub-Saharan Africa
For the Malawi pilot project, we worked with a South African-based manufacturer to produce the GEMS Sensing stations. The full-stack weather stations are configured to collect eight parameters every 15 minutes: air temperature, humidity, barometric pressure, rainfall, soil moisture, soil temperature, wind speed, and solar radiation. Data are sent via cellular network to a cloud-based database, processed for quality, and made accessible to partners via a user-friendly, web-based portal.
The primary objectives of the pilot exercise were to better understand:
Tropical environmental impacts on the sensing hardware;
Total cost of ownership from a user perspective (i.e., costs of acquisition, installation, and maintenance) involved in deploying digital ag weather sensors in a low-income context with limited infrastructure support; and
Malawian agribusiness’ demand, willingness to pay and potential use cases for networked weather stations (or related real-time sensing needs).
To date, the CAT team has deployed nearly 40 solar-powered weather stations across the spatially and temporally variable agro-ecologies that affect agricultural outcomes throughout the country. The stations continue to stream real-time data from experimental research stations, commercial farms, and smallholder farms. The pilot project is set to wrap-up in December 2023, though the CAT may continue to operate some of the weather stations beyond that time.
Learnings and Lessons
Scaling up a pilot project in Malawi from our operations based in Minnesota during the height of the global pandemic was not without its challenges. The original game plan was to travel with a handful of sensors to Malawi so that our technical team could work closely with CAT personnel and deployment partners to scope out the entire constellation of technical, human capital, cell connectivity, local logistics, device assembly and deployment partner protocols and other factors that could likely affect the odds of a successful outcome. Based on this test deployment we had envisaged tweaking the technical specs, revising our training and related deployment protocols before scaling up deployment throughout the country.
COVID-19 had other plans. It shut down all travel to Malawi, disrupted supply chains for computer chips that were critical to fabricating the GEMS designed sensors, and complicated shipping logistics. Undeterred, we pivoted our whole operation to enable a remote deployment, which, despite our best efforts, was not without its own complications.
Persistence ultimately paid. As we began scaling field deployment in April 2022, our technical team became adept at diagnosing issues long distance, ably supported by a great ground team in Malawi. Fluky cell connectivity issues seemed to be associated with variable soil properties that were vastly improved by simply raising the logger box further off the ground. Unexpected down-time issues were eventually tracked to battery depletion problems that arose from locally assembled devices that sat turned on for lengthy time before travel resumption enabled field deployment to proceed. The fix, change out the run-down batteries.
All told, our GEMS Sensing devices exceeded our expectations, even withstanding Tropical Cyclone Freddy that hit Malawi in February 2023!
Our team visited Malawi in May and traveled with the local CAT sensing team throughout the Southern and Central regions to get first-hand feedback from a host of public and private partners who participated in the GEMS Sensing pilot project. We made site visits with DARS research scientists, commercial agrifood businesses such as Bayer, Pxyus and Global Seeds, and One Acre Fund which services smallholder farmers directly. These partners were uniformly enthusiastic about the ready access to automatically streamed and easily accessible localized weather data. They also highlighted numerous opportunities for leveraging the streaming weather data streams with various backend analytics to tailor informatics solutions to the particular and varied agri-food production problems they faced.
GEMS sensors are currently being deployed with success across four continents. However, this represented our first widespread test of the system in a logistically challenged, low-income African agricultural setting. Prior to the pilot we had all sorts of questions as to whether or not the system would even work, and if so, how reliably and securely. Importantly, would anyone find practical value in such a sophisticated, real-time sensing system in a country dealing with many infrastructure and technological constraints.
Weather matters a lot for agriculture, whether you are farming in Minnesota or Malawi. While Minnesota farmers have access to all sorts of weather related data products, locally accurate, real-time data is still relatively scarce. In Malawi, rurally-relevant weather data of any sort is largely absent. The last time we checked, NOAA (National Oceanic and Atmospheric Administration) live stream weather data from just one site in Malawi, the Blantyre International airport! This pilot demonstrated the potential for changing this reality for Malawian farmers and the numerous public and private agencies that support their operations.
Even with its many hurdles and holdups, this pilot exercise revealed the feasibility and the latent demand for access to locally sensed weather data. With the lessons learned from our pilot deployment we are excited about the possibility of using GEMS Sensing’s data generation and analytical capabilities to support data-driven decisions that strengthen existing and emerging value chains in Malawi, as well as unlock new agri-food value-chains throughout the world.
This posting was produced as part of the Centre for Agricultural Transformation, an effort led by Land O’Lakes Venture37 and funded with a grant from the Foundation for a Smoke-Free World, Inc. (“FSFW”), a US nonprofit 501(c)(3) private foundation. The contents, selection and presentation of facts, as well as any opinions expressed herein, are the sole responsibility of the authors and under no circumstances should they be regarded as reflecting the positions of FSFW.