Summer Science for Youth – Expanding outreach with Bread Science

Written by
Kevin Silverstein

Who would have ever guessed that 6 years after the pandemic middle-schoolers would still be crazed about sourdough!! 

Sure enough, on February 9 at 8 am, registration for our new “Science of Bread Making” 4-day summer science event went online with 16 slots open, and within 30 minutes we were full with a 17-person waiting list. So we opened another 16 slots, creating an AM group and a PM group. The pressure was on for our team of 30 volunteers to create an unforgettable summer science experience June 15-18, 2026 for this crowd – the first offering of this new event on top of the third delivery of the Food Ag & U experience that followed the week afterwards.

Summer Science Event Generates Enthusiasm For Food Science, Ag, and Computers

Categories
Services
Written by
Kevin Silverstein

Summer Science Fun!


Last  year a dedicated team of nearly 30 scientists from CFANS, MSI, UMGC and Macalester College teamed up to create and deliver a fun-filled weeklong summer science event for middle school students. Another year has come and gone, and so too has this year’s delivery of this event. But this wasn’t simply a rinse and repeat in this second year. We analyzed reactions to last year’s delivery and met monthly all year long with the goal of improving what was already a very successful endeavor.


What were some of the changes for the second year of this program? In a major change, we carved out 20-30 minutes each morning for Tex Ostvig, leader of CFANS’s Office of Inclusive Excellence, to provide inspirational instruction to the students on leadership development activities. Students responded remarkably well to reflective exercises on how to be a good listener, what are my core values, what are the different forms of group governance and more. These highly interactive activities served to boost students' self image and really anchored them each day as they moved to each new space for instruction. In a program that changed daily by design, Tex was a constant presence each day. And once this initial activity was done, students were emotionally ready to engage with the scientific activities that followed. Check out pictures of Tex with the students in each of the 5 days in the gallery below.


We also had a new sponsor for this year’s event, Forever Green Initiative. Many thanks to them for a $10,000 grant that allowed us to provide 7 students-in-need scholarships to attend, snacks, lab supplies, porta-potties, and other incidentals, along with carry-over funds from PepsiCo and Cargill from last year.


And once again, many thanks to all the dedicated volunteers that planned this event and delivered an incredible experience for these kids!! Your nimbleness, especially when it rained necessitating plans B and C, were amazing. There is no question in my mind that we have convinced several kids to consider college, consider science, and consider the U of M as a place they want to be in the future. Way to go!


Check out a sampling of the photos from this year’s event below.


Tex highlights: Leadership activities.


Students in a classroom participating in their first leadership activity skills-building exercise
Students in small groups participating in a leadership-building activity
Students in a classroom participating in a leadership activity focused on listening skills
Students listen to a presentation on leadership focused on governing styles
Group photo of participants holding University of Minnesota folders, certificates of their completion of the camp


Day 1. Food Science and Nutrition featuring fresh ice cream and cheese (voted most memorable!)

Students in grades 6-8 wearing personal protective equipment in a food lab
Student wearing personal protective equipment cutting out a cookie shape in dough made with Kernza
Students in grades 6-8 wearing personal protective equipment getting a tour of the University of Minnesota Food Science lab
A group of students in the food science laboratory interactively performing an experiment with red cabbage leaves in different pH environments


Day 2. DNA extraction, sequencing and Mutant fruit flies

Three students examining the contents of their DNA extraction kits
Students working in groups to carry out DNA extraction
A student loads DNA onto a pen-drive-sized sequencer as the other students watch
Students shine red light onto optogenetic mutant flies that perform different actions depending on their mutation profiles


Day 3. Wheat breeding, Plant Pathology, Kernza and the Conservatory 

Students in the process of threshing wheat, blowing away the chaff
Students simulating genetic crosses with ping pong balls negotiating a first-generation cross
Demonstration of the incredible length of the roots of the perennial Kernza in comparison to the annual wheat using a life-sized image on a scroll
Students tour the conservatory at the plant growth facility


Day 4. Dairy barn activities and a walk with the calves

Students weighing animal feed in preparation for feeding the cows a balanced diet
A tour of the St. Paul Campus dairy barn
Two students herding a dairy cow out the dairy barn
Lining up 3-month old dairy cow calves at the St. Paul Campus dairy barn for a “show”


Day 5. Supercomputers and computing activities

Students get a tour of the Supercomputing Institute at the University of Minnesota
An event leader presenting on using computers to link information
Small group of students sitting at tables using what their learned all week for final camp activity
Larger view of students sitting at tables using what their learned all week for final camp activity


​This activity supported in part by: MnDRIVE Global Food Ventures, University of Minnesota​

WinterTurf hackathon and 2024–2025 sensing update

Categories
Written by
Ann Piotrowski, Majid Farhadloo, and Bryan Runck

As the WinterTurf 2024–2025 data collection season comes to a close, the WinterTurf sensing nodes are being removed to make way for spring maintenance and regular golf course operations. This winter marked our largest data collection effort yet, with 75 sensing nodes deployed across the northern hemisphere at golf courses and research sites. These nodes collected 702,905 data packets and 16,713,955 sensor readings, capturing the daily changes that influence turf health during the harshest months of the year.

By refining our technology and pursuing collaborative research, we aim to equip superintendents with the knowledge they need to protect and maintain their greens throughout the winter.

Technological advancements in WinterTurf sensing


This season, our team introduced sensing improvements to our data collection and sensor monitoring efforts. Our new Command Execution (CommandExe) support tool for our v3 data logger enables a remote command function to check connectivity and fine-tune functionality. Additionally, our updated dashboards provide real-time diagnostics, improving our daily monitoring capabilities.


With every season comes challenges. Some courses experienced poor cellular signal or quality, not allowing the node to send data in real time and limiting our remote access for diagnostics. To address this issue, our system is designed to store all data locally on an internal microSD card, which we can download once the node comes back to the lab in the spring. Another challenge in winter is the limited sunlight – our system relies on incoming solar energy with a battery backup. During the darkest months, some nodes still require manual battery charging by course superintendents, ensuring continued operation in very low-light conditions.


Exploring data through a multidisciplinary hackathon


Recently, we had an exciting two-day intensive hackathon event that included researchers, data scientists, and turfgrass experts. The meeting aimed to generate research questions and uncover patterns at a fast-paced tempo using our growing and extensive dataset. The group explored questions such as:


  • How do CO2 accumulation rates differ between these three cover conditions: ice, impermeable covers, and impermeable covers and ice (Figure 1)?
  • Which combination of fall practices correlates most strongly with reduced winterkill damage?
  • How do light intensity levels under different covers correlate with turfgrass recovery rates?


A bar graph showing weekly average CO2 levels under various winter turf cover types including impermeable covers and ice.

Figure 1. Exploratory bar graph showing weekly average CO2 levels under cover types: impermeable covers, ice, both ice and impermeable covers, or other cover type. Credit: Majid Farhadloo.


While the hackathon was mainly exploratory, it identified new directions for future research. The collaborative meeting highlighted the value of multidisciplinary analysis in understanding complex environmental data.


A banner image representing WinterTurf data collection efforts on golf courses across the northern hemisphere during winter.

A banner image representing WinterTurf data collection efforts on golf courses across the northern hemisphere during winter.


Final thoughts


Our goal remains the same: to provide golf course managers with research-based knowledge and tools for winter turf management. By refining our technology and pursuing collaborative research, we aim to equip superintendents with the knowledge they need to protect and maintain their greens throughout the winter. As we reflect on another successful season, we look forward to further advancements. Stay tuned for more updates as we continue to dig into the data.


​This activity supported in part by: MnDRIVE Global Food Ventures, University of Minnesota

A Prototype Tool for Integrating Agrometeorological Data Across Sources

Categories
Written by
Bryan C. Runck

As part of our ongoing work to improve the use of environmental data in agricultural research, we recently published a prototype tool that integrates multiple agrometeorological data sources into a unified access and querying system. This tool demonstrates how general-purpose extract-transform-load (ETL) systems can reduce overhead and improve data usability for digital agriculture workflows.

Researchers often spend a lot of time downloading, cleaning, and reformatting the same climate datasets from multiple providers. Each data source has its own format, API conventions, and spatial-temporal structures. Our prototype simplifies this by offering a standardized, open-source interface that harmonizes disparate sources and automates many of the most common processing tasks.

Man Typing on Computer with stats and graphs depicted


Built with extensibility and usability in mind, the system includes separate ETL managers for each dataset and supports spatial and temporal aggregation across user-defined parameters. Outputs can be downloaded as CSV or JSON, and users can access the tool through either a graphical user interface or a RESTful API. The system currently runs on Windows, Mac, and Linux and is designed to be lightweight and usable by researchers without extensive programming backgrounds.

We used Minnesota as the case study for this prototype. We were able to explore how researchers might customize queries for specific cropping systems, field experiments, or landscape-scale assessments. We believe this kind of data interface is especially important in the context of changing climates, where the ability to quickly assemble regionally and temporally relevant data can support adjustments to cropping calendars, irrigation schedules, and other time-sensitive decisions.

The project was supported by the Minnesota Environment and Natural Resources Trust Fund and the Legislative-Citizen Commission on Minnesota Resources. We hope this prototype serves not only as a useful tool for others but also as an example of how modular ETL architectures can be applied more broadly to agricultural and environmental research challenges.

The code is available under an open-source license


To see related activities by Bryan Runck, check out my Lab Page.


​This activity supported in part by MnDRIVE Global Food Ventures, University of Minnesota

Food Agriculture & U Summer Science Camp

Written by
Kevin Silverstein

Fun for everyone at interdisciplinary Food Agriculture and U summer science camp

Imagine going to an agriculturally-themed summer camp where you got to see and taste protein bars, puffed cereal, ice cream and cheese being made at an industrial grade facility; did experiments where you pulled iron out of fortified breakfast cereal; extracted and sequenced DNA from your food; used a supercomputer to decipher that DNA; simulate a wheat breeding experiment and identify diseased plants in the field; stick your arm inside a dairy cow’s stomach, and lead your own dairy calf in a field by the barns! Wow, that’s a lot to experience in one week. But that’s precisely what 15 brave, inquisitive and incredibly bright 11, 12 and 13-year olds did at the inaugural launch of the ‘Food, Agriculture and U’ summer science camp, held in collaboration with the University of Minnesota’s Youth Programs June 24-28, 2024.


The camp was initially conceived by Kevin Silverstein at the Minnesota Supercomputing Institute and at GEMS Informatics, George Annor at the CFANS Department of Food Science and Nutrition, and Getiria Onsongo, at Macalester College and GEMS. But they soon found that people from all over the University loved the idea and joined the effort, volunteering their time. In all, more than 25 professionals ended up making significant contributions to the camp, nearly all interacting directly with the kids on one or more of the 5 days. Special thanks to co-organizing leaders Shea Anderson and Daryl Gohl at the UMGC, Emily Conley and Becca Hall at Agronomy & Plant Genetics and Plant Pathology, and Tony Seykora and Isaac Salfer in Animal Science for their extensive planning and staff recruitment.


In recruiting students for the camp, significant effort was made to reach the Native American community. An outstanding liaison at each of two institutions, Migizi in Minneapolis and the American Indian Magnet School in St. Paul, helped us recruit students that normally miss out on these opportunities. We also attended two powwows and appealed to families there directly.


Corporate sponsors were also amenable to the concept. We are very grateful for contributions from PepsiCo, Cargill, and Fairbault Foods for allowing us to provide a free camp experience for 6 of our 15 students. And they also allowed us to purchase healthy snacks (which the kids greatly appreciated and kept talking about) for all participants each day. Thanks also go to NSF and ACCESS for an allocation that enabled the students to decode their DNA sequence on the Nations' supercomputing infrastructure, and to the Digital Science Initiative for helping us to manage donations. 


Please check out the gallery which has 4 photos from each day, highlighting the diversity of activities. Miraculously, even though this was the first time giving this camp, all 5 days went forward smoothly and were a great hit. There are a few tweaks to make next year for sure, but the response was overwhelmingly positive and we are all delighted!

Day 1

Exploring Food Science and Nutrition


Camp students in Food Science Lab


Day 2

DNA sequencing, extraction and mutants


plant DNA extraction in a lab
students looking at plant DNA properties


camp students reviewing optogenetics
plant DNA extraction in a lab


Day 3

Linking ag data via supercomputers


computer exercise
students touring the Minnesota Supercomputer


database review
students in conference room


Day 4

Visiting agricultural fields on campus with breeders and plant doctors


student wheat threshing
students in farm field


students in a field
students in a field


Day 5

Out in the barns with the dairy cattle


students with animal feed


group of students walking a dairy calf


student with dairy cow


​This activity supported in part by MnDRIVE Global Food Ventures, University of Minnesota

Relaunching GEMS Informatics Exchange APIs

Services
Written by
Kevin Silverstein and Phil Pardey

APIs: Now well-documented and much easier to use

One of the big frustrations in using computing to solve large, multidisciplinary challenges is managing data sets from different disciplines. Often, you have to go to each individual site and download the entire dataset. Then you have to parse out the subset of data fields you want within the geographies, spatial resolutions and time periods you care about. It is still the case that a few groups provide their data in the form of an Application Programmer Interface (API), where the data are served in a structured form with clear metadata documentation. Data can be sliced and diced how you like, selecting subsets of geography, time, and variables of interest. Once you sign up and obtain an API key, it just takes a few lines of code in Python or R to establish a connection and query at will!

GEMS has been building out a portfolio of APIs since 2021 across a range of useful datasets seeking to span the full Genetics x Environment x Management x Socioeconomic data landscape. Those who tried GEMS Exchange before will know that we used to have a middle layer managed by RapidAPI. Users found that cumbersome and confusing, so we are now using our own Apache APISIX server within our own web pages to serve you your key and monitor usage. We’re confident that your experience will be super easy this time around. Let’s get you started!

First, check out which APIs might interest you at our GEMS Exchange page. To obtain your API key simply click here for key. (Note you will need to have a Globus.org account, which is free – or you can connect via your academic institution, Google account, or ORCID). Once you know which APIs interest you, explore our collection of Jupyter notebooks in Github that give you practical guidance on how to use them. Many of the APIs we offer use the GEMS Grid which help ensure they are interoperable. And the GEMS Grid itself has recently been made open source, so you can place your own data sets on the Grid and interoperate with the community.

We are always happy to hear of useful datasets that could be added to the GEMS gridded collection in Exchange, so by all means reach out with suggestions or queries here.


​This activity supported in part by MnDRIVE Global Food Ventures, University of Minnesota

The GEMS Informatics Grid Goes Open Source

Written by
Kevin Silverstein

We are delighted to announce that we have just released the GEMS Grid code library, where the code is under the open source Apache 2.0 license, which allows anyone to use the code for commercial or non-commercial purposes – you simply need to provide attribution to GEMS Informatics when you use or modify it.

Just before we at GEMS Informatics started developing Application Programmer Interfaces (APIs) in agriculture for GEMS Exchange, GEMS geospatial expert Jeffery Thompson worked with others in the GEMS team and colleagues at NSIDC to develop the GEMS Grid, a hierarchical discrete global gridding system. This Grid has allowed us to provide data sets at different resolutions ranging from 36 km to 1 m, and still have them remain functionally interoperable. The interoperability is possible because we have written the code to allow users to project data onto the grid, aggregate data to coarser resolutions, and, notably, also disaggregate data to finer resolutions. The latter operation is ordinarily a difficult problem, but is made easier, as I discuss below, since we enable the users of our code to thoughtfully address it in a standardized, replicable way.

Many problems in agriculture (e.g., understanding the spatial location of crop production) require equal area parcels of land to do proper calculations. Working with strict lat-lon coordinates won’t suffice as areas near the equator are significantly different in size as areas near the poles. The GEMS Grid preserves equal-area assumptions as it divides land, so you can do these calculations with confidence, and preserve aggregation-disaggregation consistency in the data, even if you are not a GIS expert.

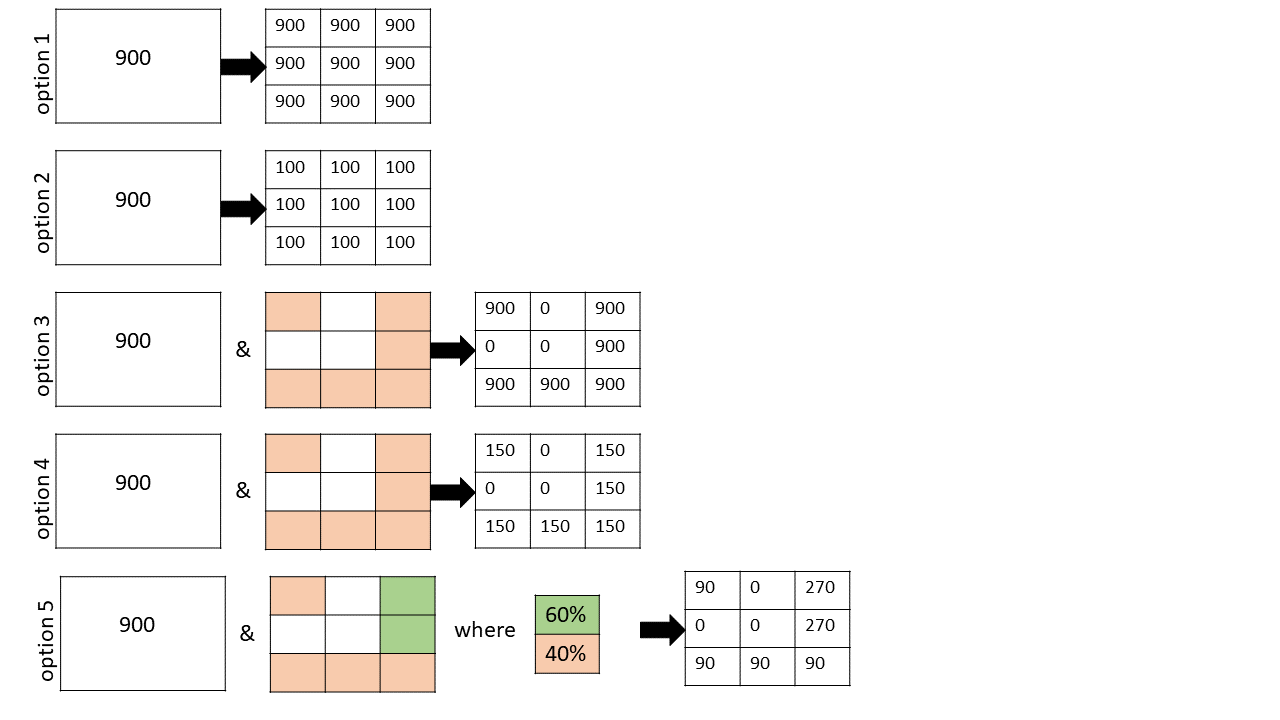
Pictorial description of the 5 options for disaggregation on the GEMS Grid

So let’s look at the 5 options for disaggregation that GEMS geospatial developer Olena Boiko included in the GEMS grid toolbox, schematically described in the figure she developed above.

Option 1. Value transference. 
In this case, if you were to subdivide a 3 km2 resolution grid cell into 9 x 1 km2 cells, this option would be appropriate for any value that is deemed roughly constant throughout the area applied. Examples would be rainfall in inches or grain yield in bushels / acre.

Option 2. Even value division. 
Sometimes the quantity measured in a cell represents a cumulative value for the area in which it is reported. In this case, if the parent cell is homogenous, then splitting it up into 9 equal-area pieces would require that you divide the value in each equivalent cell by a factor of 9. Examples where this selection makes sense include grain production in bushels, crop acreage, and population.

Option 3. Value transference with a mask. 
This one is similar to Option 1 except we are no longer making the assumption that the distribution of values in the parent cell is spatially homogeneous. For example suppose you were measuring grain yield, but you knew that 3 of your nine cells had buildings occupying them (see white areas in the Figure). In this case you only transfer your values to 6 remaining cells (colored peach) that have arable land. Cells are binary with this option (i.e., either allowed a value or not).

Option 4. Even value division with a mask. 
Analogously, you can mask out cells in the value division case when you know that your daughters cells are not all equal. This is just like the case in Option 3, except you divide your parent-cell value evenly by the number of viable daughter cells. In this pictorial example, there are 6 viable daughter cells, so each gets a value of 900/6 = 150. This would be appropriate if you were computing grain production in bushels and you had a total value that needed to be split up across the 6 arable daughter parcels.

Option 5. Flexible division with a mask. 
This scenario is the most flexible, and allows the user to create a master mask with arbitrary weights at each daughter cell. It allows you to block off daughter cells entirely, and prescribe the relative weights of all remaining daughter cells. This is ideal for situations where you are allocating crop distributions and you want to avoid certain land use features (e.g., lakes, forests, housing) and probabilistically distribute the remaining crop areas (e.g., with higher probability near soils with a high SSURGO National Commodity Crop Productivity Index).

I’m confident these flexible disaggregation tools will provide much easier, more accurate, and replicable solutions for your particular spatial analytic problem. So please give them a try!


​This activity supported in part by MnDRIVE Global Food Ventures, University of Minnesota

Water Resources and Sensing Conference Session

Written by
Kevin Silverstein

Assessing BMP Effectiveness for Water Quality Outcomes with Remote Sensing

Virtually everyone in Minnesota and bordering states whose profession has a direct stake in Water Conservation assembled in Downtown St. Paul’s RiverCentre October 17-18 for the annual Water Resources Conference. I had the honor of chairing a Special Session at the conference titled “Assessing BMP Effectiveness for Water Quality Outcomes with Remote Sensing.” The session featured two very foundational efforts that we are attempting to bridge together in partnered research at GEMS: (1) The Minnesota Department of Agriculture’s (MDA) Minnesota Agricultural Water Quality Certification Program (MAWQCP), directed by Brad Jordahl Redlin, and (2) the Department of Forest Resources’ remote-sensed Water Quality assessment for our 10,000+ lakes, led by Leif Olmanson.


The 90-minute session was organized so that each of the three speakers (one had dropped out last minute for logistical reasons) had 20 minutes to speak plus two minutes for burning questions. At the end the audience had 15 minutes for questions with the entire panel of speakers. There were about 30 very inquisitive people in the audience, who peppered the speakers with questions throughout.

Updates on the MDA’s certification program

Brad Jordahl Redlin kicked off the session with an outstanding talk that outlined the principles on which the certification program he founded and directs was created, and highlighted the progress that has been made. Literally over a million acres have now been certified, spread across over 1400 producers. In exchange for regulatory certainty for a period of time, these producers allow his government agency to (1) assess their farm practices, (2) suggest new management practices (sometimes with additional incentives such as subsidized equipment from a grant), and (3) carry out audits of their new practices. The program, which has been operational for nearly a decade, is well beyond the stage of corralling early-adopters. New participants span the spectrum of producer demographics in age, farm size, and more.
 

Brad Jordahl Redlin of the MDA talking at the WRC Special Session

Scaling lake quality measurement

Leif Olmanson stepped up to review an activity that he first spearheaded twenty years ago – using remote sensing to measure the water quality of Minnesota lakes. In the interim, he has overseen steady progress using new generations of satellites (from Landsat to Sentinel), multiple metrics (clarity, chlorophyll, organic matter), and the frequency of data reporting (from once every 5 years to ~weekly lake snapshot and monthly pixel-level composites of all 10,000+ lakes). Data is made available to the casual user via a friendly Lake Browser interface, and in numeric form pixel-by-pixel for data wizards on GEMS Exchange.
 

Leif Olmanson of the UMN Dept. of Forest Resources talking at the WRC Special Session

GEMS bridging the two programs

David Porter rounded out the session discussing the improvements he has made in creating algorithms that properly remove clouds and aerosols from the satellite images. This is a prerequisite for feeding all of the regularly spaced (~5 day) images of a field through a growing season into a sophisticated Recurrent Neural Network (RNN, a type of Machine Learning algorithm) that his colleague Anubha Agrawal has been preparing. As described in this case study, David, Anubha, and I intend to use the RNN trained on known, certified management practices (e.g., strip till / no till, cover crops) from the MAWQCP to make a prediction of what practices growers are making on uncertified farmland. We then will trace these producer fields to the downstream lakes in each watershed, and see what covariates (e.g., slope, soil type, distance to waterway) affect the correlation of % farm practice adoption vs. downstream lake quality in a watershed.


​This activity supported in part by MnDRIVE Global Food Ventures, University of Minnesota