Reimagining Partnerships to Transform the Agri-food Innovation Chain

Written by
Philip Pardey

University of Minnesota alum and Nobel Peace Prize laureate Norman Borlaug often implored agricultural scientists to look beyond their lab benches and “take it to the farmer.” As economies develop, farmers become embedded in ever-more complex and interconnected agri-food value chains (AVCs). A 21st century variant of Borlaug’s challenge is “take it to the farmer, and beyond!” Like the value chains being served, innovation in the agri-food sciences must now recognize the close connectivity between the pre-, on- and post-farm links within rapidly changing AVCs to sustainably improve their economic and environmental performance.

Notably, the private sector now plays a much larger and expanding role in research, development and innovation (RDI) for AVCs worldwide. While this opens new opportunities to spur innovation along AVCs, it also requires the public sector to rethink and reposition their R&D roles, cognizant of the potential for productive public-private innovation partnerships while also prioritizing the types of R&D for which the public sector has comparative advantages.

GEMS Informatics has teamed up with 2Blades to host a Deep Dive Session at the 2025 Borlaug Dialogue, convened by the World Food Prize Foundation in Des Moines Iowa, October 21-24.

This in-person session will be held on Wednesday, October 22 from 3:15 – 4:15pm at the Iowa Event Center in Des Moines. Entitled “Reimagining Partnerships to Transform the Agri-food Innovation Chain,” the session will explore how innovative public-private R&D partnerships can (and must) accelerate innovations that tackle, and help solve, the myriad challenges facing agri-food value chains now and in the decades ahead.  

The session will cover the following topics:

  • The changing global realities of agri-food R&D
  • Lessons from successful public-private innovation partnerships
  • Efficiency drivers across crops, regions, and stages of the innovation chain
  • Pathways to equitable, sustainable, and resilient food systems

WinterTurf hackathon and 2024–2025 sensing update

Categories
Written by
Ann Piotrowski, Majid Farhadloo, and Bryan Runck

As the WinterTurf 2024–2025 data collection season comes to a close, the WinterTurf sensing nodes are being removed to make way for spring maintenance and regular golf course operations. This winter marked our largest data collection effort yet, with 75 sensing nodes deployed across the northern hemisphere at golf courses and research sites. These nodes collected 702,905 data packets and 16,713,955 sensor readings, capturing the daily changes that influence turf health during the harshest months of the year.

By refining our technology and pursuing collaborative research, we aim to equip superintendents with the knowledge they need to protect and maintain their greens throughout the winter.

Technological advancements in WinterTurf sensing


This season, our team introduced sensing improvements to our data collection and sensor monitoring efforts. Our new Command Execution (CommandExe) support tool for our v3 data logger enables a remote command function to check connectivity and fine-tune functionality. Additionally, our updated dashboards provide real-time diagnostics, improving our daily monitoring capabilities.


With every season comes challenges. Some courses experienced poor cellular signal or quality, not allowing the node to send data in real time and limiting our remote access for diagnostics. To address this issue, our system is designed to store all data locally on an internal microSD card, which we can download once the node comes back to the lab in the spring. Another challenge in winter is the limited sunlight – our system relies on incoming solar energy with a battery backup. During the darkest months, some nodes still require manual battery charging by course superintendents, ensuring continued operation in very low-light conditions.


Exploring data through a multidisciplinary hackathon


Recently, we had an exciting two-day intensive hackathon event that included researchers, data scientists, and turfgrass experts. The meeting aimed to generate research questions and uncover patterns at a fast-paced tempo using our growing and extensive dataset. The group explored questions such as:


  • How do CO2 accumulation rates differ between these three cover conditions: ice, impermeable covers, and impermeable covers and ice (Figure 1)?
  • Which combination of fall practices correlates most strongly with reduced winterkill damage?
  • How do light intensity levels under different covers correlate with turfgrass recovery rates?


A bar graph showing weekly average CO2 levels under various winter turf cover types including impermeable covers and ice.

Figure 1. Exploratory bar graph showing weekly average CO2 levels under cover types: impermeable covers, ice, both ice and impermeable covers, or other cover type. Credit: Majid Farhadloo.


While the hackathon was mainly exploratory, it identified new directions for future research. The collaborative meeting highlighted the value of multidisciplinary analysis in understanding complex environmental data.


A banner image representing WinterTurf data collection efforts on golf courses across the northern hemisphere during winter.

A banner image representing WinterTurf data collection efforts on golf courses across the northern hemisphere during winter.


Final thoughts


Our goal remains the same: to provide golf course managers with research-based knowledge and tools for winter turf management. By refining our technology and pursuing collaborative research, we aim to equip superintendents with the knowledge they need to protect and maintain their greens throughout the winter. As we reflect on another successful season, we look forward to further advancements. Stay tuned for more updates as we continue to dig into the data.


​This activity supported in part by: MnDRIVE Global Food Ventures, University of Minnesota

A Prototype Tool for Integrating Agrometeorological Data Across Sources

Categories
Written by
Bryan C. Runck

As part of our ongoing work to improve the use of environmental data in agricultural research, we recently published a prototype tool that integrates multiple agrometeorological data sources into a unified access and querying system. This tool demonstrates how general-purpose extract-transform-load (ETL) systems can reduce overhead and improve data usability for digital agriculture workflows.

Researchers often spend a lot of time downloading, cleaning, and reformatting the same climate datasets from multiple providers. Each data source has its own format, API conventions, and spatial-temporal structures. Our prototype simplifies this by offering a standardized, open-source interface that harmonizes disparate sources and automates many of the most common processing tasks.

Man Typing on Computer with stats and graphs depicted


Built with extensibility and usability in mind, the system includes separate ETL managers for each dataset and supports spatial and temporal aggregation across user-defined parameters. Outputs can be downloaded as CSV or JSON, and users can access the tool through either a graphical user interface or a RESTful API. The system currently runs on Windows, Mac, and Linux and is designed to be lightweight and usable by researchers without extensive programming backgrounds.

We used Minnesota as the case study for this prototype. We were able to explore how researchers might customize queries for specific cropping systems, field experiments, or landscape-scale assessments. We believe this kind of data interface is especially important in the context of changing climates, where the ability to quickly assemble regionally and temporally relevant data can support adjustments to cropping calendars, irrigation schedules, and other time-sensitive decisions.

The project was supported by the Minnesota Environment and Natural Resources Trust Fund and the Legislative-Citizen Commission on Minnesota Resources. We hope this prototype serves not only as a useful tool for others but also as an example of how modular ETL architectures can be applied more broadly to agricultural and environmental research challenges.

The code is available under an open-source license


To see related activities by Bryan Runck, check out my Lab Page.


​This activity supported in part by MnDRIVE Global Food Ventures, University of Minnesota

Using AI to Revolutionize Sustainable Farming

GEMS Informatics and Water Quality Management

Fertilizers are essential for boosting crop yields and increasing farm productivity. However, excessive use of fertilizers not only incurs high costs for farmers but also leads to harmful runoff that pollutes waterways. To address these challenges, GEMS Informatics is collaborating with the Minnesota Department of Agriculture’s Water Quality Certification Program and colleagues from the University of Minnesota. Together, they are leveraging AI and data science, in combination with ground-truth and remote-sensed data, to inform farmers of best management practices and track the water quality outcomes of those practices at scale.

The Problem with Over-Fertilization

While fertilizers play a crucial role in modern farming, their overuse can be detrimental. Excess fertilizers often wash into nearby water bodies, causing environmental pollution and financial waste for farmers. The key to effective fertilizer management lies in precise measurement and informed decision-making.

Harnessing Data for Sustainable Practices

Brad Jordahl Redlin, Water Quality Certification Program Manager at the Minnesota Department of Agriculture, emphasizes the importance of GEMS Informatics' work: “GEMS is building the analytical backend, linking farmer fields to watersheds and monitoring ongoing water quality. This will enable us to measure the positive effects of our certification program.”

Kevin Silverstein, Operations Manager at GEMS Informatics, adds: “We use satellite imagery to support government policy. Partnering with the Department of Agriculture, we train machine learning programs to recognize sustainable practices like strip-till or no-till farming, and cover crops and buffer strips that prevent water runoff. We can then correlate these practices with their impact on water quality and provide recommendations to the certification program.”

Advanced Monitoring with Satellite Technology

In collaboration with CFANS colleague and remote sensing water quality expert Leif Olmanson, GEMS Informatics employs satellite technology and supercomputers to monitor water quality. Monthly averages of satellite signals provide comprehensive measurements across Minnesota’s lakes, even those seldom exposed to direct sunlight.

Machine learning algorithms developed by GEMS require regular, unobstructed satellite signals. To ensure accuracy, GEMS imputes missing data using adjacent pixels in time and space. This approach turns vast amounts of data into actionable insights, empowering policymakers and farmers while safeguarding privacy.

Jim Wilgenbusch, Director of Research Computing at the University of Minnesota, praises GEMS Informatics' innovative approach: “It’s extremely exciting that they push at the boundaries of what researchers traditionally considered possible. GEMS sits at the intersection of a database where you store, catalog, and organize information, and modeling that information on a massive scale. It has huge potential to support researchers in their work at the cutting edge.”

A Collaborative Effort

GEMS Informatics integrates efforts from various University of Minnesota schools and institutions, including U-Spatial, Research Computing, the Data Science Initiative, the Minnesota Supercomputing Institute and the College of Food, Agricultural, and Natural Resource Sciences. Additionally, GEMS partners with state institutions like the Minnesota Department of Agriculture and multinational companies to drive data-driven innovation in the agri-food sector.

By combining AI, data science, and collaborative efforts, GEMS Informatics is paving the way for sustainable farming practices that benefit both the environment and the farming community.


​This activity supported in part by MnDRIVE Global Food Ventures, University of Minnesota
 

Relaunching GEMS Informatics Exchange APIs

Services
Written by
Kevin Silverstein and Phil Pardey

APIs: Now well-documented and much easier to use

One of the big frustrations in using computing to solve large, multidisciplinary challenges is managing data sets from different disciplines. Often, you have to go to each individual site and download the entire dataset. Then you have to parse out the subset of data fields you want within the geographies, spatial resolutions and time periods you care about. It is still the case that a few groups provide their data in the form of an Application Programmer Interface (API), where the data are served in a structured form with clear metadata documentation. Data can be sliced and diced how you like, selecting subsets of geography, time, and variables of interest. Once you sign up and obtain an API key, it just takes a few lines of code in Python or R to establish a connection and query at will!

GEMS has been building out a portfolio of APIs since 2021 across a range of useful datasets seeking to span the full Genetics x Environment x Management x Socioeconomic data landscape. Those who tried GEMS Exchange before will know that we used to have a middle layer managed by RapidAPI. Users found that cumbersome and confusing, so we are now using our own Apache APISIX server within our own web pages to serve you your key and monitor usage. We’re confident that your experience will be super easy this time around. Let’s get you started!

First, check out which APIs might interest you at our GEMS Exchange page. To obtain your API key simply click here for key. (Note you will need to have a Globus.org account, which is free – or you can connect via your academic institution, Google account, or ORCID). Once you know which APIs interest you, explore our collection of Jupyter notebooks in Github that give you practical guidance on how to use them. Many of the APIs we offer use the GEMS Grid which help ensure they are interoperable. And the GEMS Grid itself has recently been made open source, so you can place your own data sets on the Grid and interoperate with the community.

We are always happy to hear of useful datasets that could be added to the GEMS gridded collection in Exchange, so by all means reach out with suggestions or queries here.


​This activity supported in part by MnDRIVE Global Food Ventures, University of Minnesota

The GEMS Informatics Grid Goes Open Source

Written by
Kevin Silverstein

We are delighted to announce that we have just released the GEMS Grid code library, where the code is under the open source Apache 2.0 license, which allows anyone to use the code for commercial or non-commercial purposes – you simply need to provide attribution to GEMS Informatics when you use or modify it.

Just before we at GEMS Informatics started developing Application Programmer Interfaces (APIs) in agriculture for GEMS Exchange, GEMS geospatial expert Jeffery Thompson worked with others in the GEMS team and colleagues at NSIDC to develop the GEMS Grid, a hierarchical discrete global gridding system. This Grid has allowed us to provide data sets at different resolutions ranging from 36 km to 1 m, and still have them remain functionally interoperable. The interoperability is possible because we have written the code to allow users to project data onto the grid, aggregate data to coarser resolutions, and, notably, also disaggregate data to finer resolutions. The latter operation is ordinarily a difficult problem, but is made easier, as I discuss below, since we enable the users of our code to thoughtfully address it in a standardized, replicable way.

Many problems in agriculture (e.g., understanding the spatial location of crop production) require equal area parcels of land to do proper calculations. Working with strict lat-lon coordinates won’t suffice as areas near the equator are significantly different in size as areas near the poles. The GEMS Grid preserves equal-area assumptions as it divides land, so you can do these calculations with confidence, and preserve aggregation-disaggregation consistency in the data, even if you are not a GIS expert.

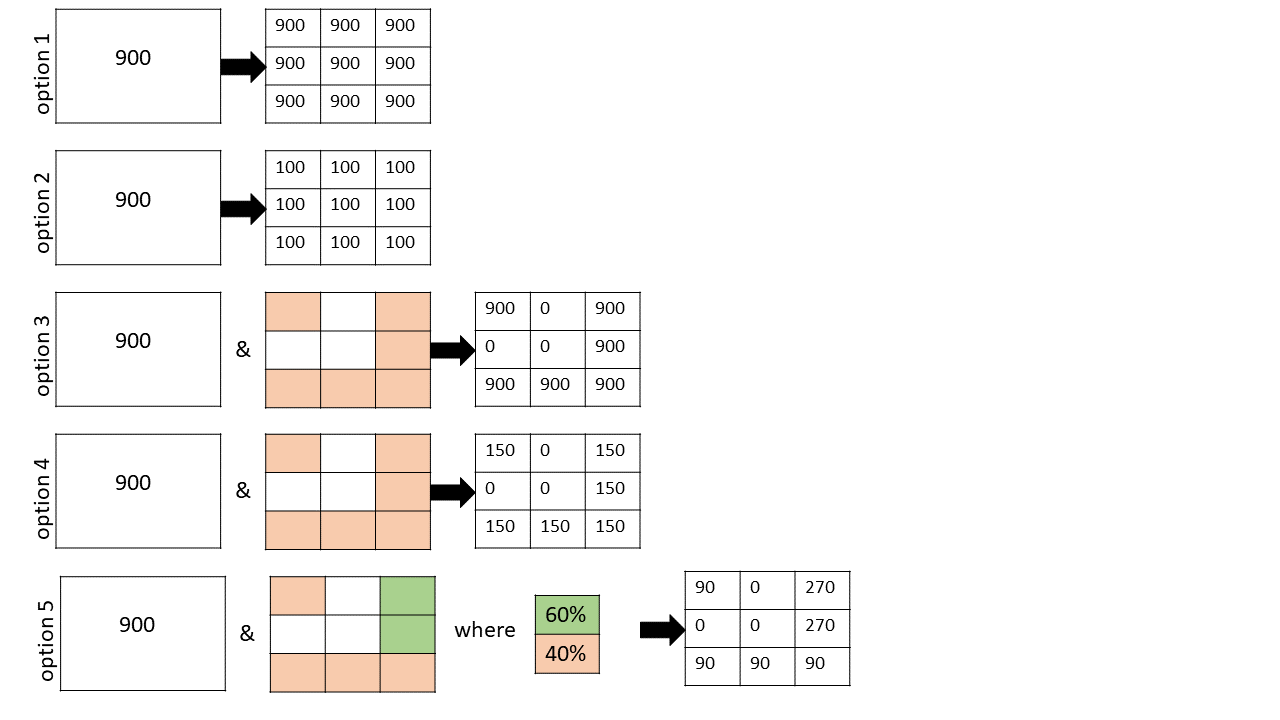
Pictorial description of the 5 options for disaggregation on the GEMS Grid

So let’s look at the 5 options for disaggregation that GEMS geospatial developer Olena Boiko included in the GEMS grid toolbox, schematically described in the figure she developed above.

Option 1. Value transference. 
In this case, if you were to subdivide a 3 km2 resolution grid cell into 9 x 1 km2 cells, this option would be appropriate for any value that is deemed roughly constant throughout the area applied. Examples would be rainfall in inches or grain yield in bushels / acre.

Option 2. Even value division. 
Sometimes the quantity measured in a cell represents a cumulative value for the area in which it is reported. In this case, if the parent cell is homogenous, then splitting it up into 9 equal-area pieces would require that you divide the value in each equivalent cell by a factor of 9. Examples where this selection makes sense include grain production in bushels, crop acreage, and population.

Option 3. Value transference with a mask. 
This one is similar to Option 1 except we are no longer making the assumption that the distribution of values in the parent cell is spatially homogeneous. For example suppose you were measuring grain yield, but you knew that 3 of your nine cells had buildings occupying them (see white areas in the Figure). In this case you only transfer your values to 6 remaining cells (colored peach) that have arable land. Cells are binary with this option (i.e., either allowed a value or not).

Option 4. Even value division with a mask. 
Analogously, you can mask out cells in the value division case when you know that your daughters cells are not all equal. This is just like the case in Option 3, except you divide your parent-cell value evenly by the number of viable daughter cells. In this pictorial example, there are 6 viable daughter cells, so each gets a value of 900/6 = 150. This would be appropriate if you were computing grain production in bushels and you had a total value that needed to be split up across the 6 arable daughter parcels.

Option 5. Flexible division with a mask. 
This scenario is the most flexible, and allows the user to create a master mask with arbitrary weights at each daughter cell. It allows you to block off daughter cells entirely, and prescribe the relative weights of all remaining daughter cells. This is ideal for situations where you are allocating crop distributions and you want to avoid certain land use features (e.g., lakes, forests, housing) and probabilistically distribute the remaining crop areas (e.g., with higher probability near soils with a high SSURGO National Commodity Crop Productivity Index).

I’m confident these flexible disaggregation tools will provide much easier, more accurate, and replicable solutions for your particular spatial analytic problem. So please give them a try!


​This activity supported in part by MnDRIVE Global Food Ventures, University of Minnesota

Become a Data Scientist for Digital Agri

Services
Written by
Kevin A. T. Silverstein

What skills should you be building for a career as a data scientist in Digital Agriculture?

Everything we do has a spatial and temporal component. These days GIS skills are a big plus!

I often have students come to me saying “I’m passionate about the agri-food sector and I want to do data science. What skills do I need to land a satisfying job, and ultimately a career, in this area?” So I figured I’d take the opportunity to share what I typically say to them here, for the benefit of all those out there with similar goals and interests. Key items are in bold.

First off, there is so much unstructured data out there, in disparate formats and locations that you aren’t going to get far without a programming language under your belt. And in this field, that really boils down to Python and/or R. Sure, Chat-GPT can write code, but trust me, it’s not there yet.

Next, everything we do has a spatial and temporal component. These days GIS skills are a big plus! You don’t have to be a GIS expert, but you should know what a coordinate reference system and datum are, understand the limitations and practicalities of aggregation and disaggregation to different levels of resolution, and be facile with vector and raster manipulations.

Data science applied to any domain involves statistics and modeling. Moving beyond point estimates with p-values and understanding Bayesian statistics will get you far. And an understanding of databases (e.g., relational, graph, or columnar) can also be useful.

Finally, many datasets are incredibly large, so analyses often can’t be performed on your laptop. So familiarity with doing analyses on High-Performance Computing (HPC) infrastructure can be critical. These systems have mechanisms in place for you to schedule jobs to be run across multiple processors in tandem with other people’s jobs, and there are conventions and rules of etiquette for that.

Depending on the positions you have in your wish list, you may want to be sure to have either a Masters level degree or Ph.D. Masters should suffice if you’re happy to have someone else identify and devise the scope of the problems you work on. If you want to do pure R&D and define your own problems, a Ph.D. will likely be necessary.

If you're lacking some of these skills or qualifications, there are numerous data science degrees offered across the country, as well as short instructional modules such as those included in GEMS Learning.


​This activity supported in part by MnDRIVE Global Food Ventures, University of Minnesota

Building a Platform for Agri-Food Informatics

Categories
Written by
Joe Axberg

GEMS at the Intersection of Technology and Agriculture

Hi, I’m Joe Axberg, an Application Engineer at the Minnesota Supercomputing Institute (MSI).  I am part of the Development and Operations team that builds and maintains our GEMS applications and services. It is through that backend “IT” lens that I will be writing my first post on our blog site.  Others on the GEMS team will be blogging about all the great things being done with GEMS - in other words - how GEMS is being used and how it is making a difference.  In this post though, I’d like to talk a little bit about the technology that powers GEMS.

Here at the University of Minnesota, GEMS is a collaboration between the College of Food, Agricultural, and Natural Resource Sciences (CFANS) and Research Computing, including the Minnesota Supercomputer Institute (MSI) and U Spatial.  The MSI is responsible for providing a variety of high performance computing resources to researchers across the University and beyond. The kind of high performance computing power needed to solve the big problems and crunch the big data.

Utilizing high performance computing can be challenging, complex, and intimidating.  In the agri-food research space, adoption of high performance computing has historically not been very high. Agri-food researchers are not computer scientists - but neither should we need them to be.   Applications and tools should exist that lower the barrier to access high performance computing to the agri-food researcher.

Hence the development of the GEMS Informatics and GEMS Learning Platforms.

What is Informatics? 

A quick Google search revealed this definition:

“the science of processing data for storage and retrieval”

“...processing data for storage and retrieval” - that certainly does sum up what the GEMS platform does - in a perhaps over-simplified way.  At GEMS, we expand on that definition: “turning…data into actionable information for farmers, scientists, governments or companies…” (Check it out at our About Page)

These days it is all about the data and the amount of data is immense - especially in the agri-food sector.  Challenges abound in the form of sustainability, changing climate, distribution, and more.  The data is out there and there is a lot of it.

The volume and complexity of this data often means that traditional methods for gathering, cleaning, organizing, storing, and analyzing data run out of steam. 

The aim of the GEMS Informatics platform is to make the job of the agri-food researcher easier.  An application that allows the data to become actionable more quickly.  Present within GEMS are applications and services that can handle the entire lifecycle of agri-food data.

Coupled with the GEMS platform is GEMS Learning.  Provided are a series of training modules and courses for upskilling agri-food researchers in the use of technology.  GEMS Learning is constantly developing and looking at new training opportunities for agric-food researchers in the area of high performance computing.

What Powers GEMS Informatics?

At risk of sounding cliche’, it really is about the people. Please visit the GEMS website to learn more about the passionate group of researchers, professors, technologists, and administrators who make GEMS possible.

On the technical side, the GEMS platform is a thoroughly modern platform developed using some of the latest technologies and techniques.  The various components of the GEMS platform leverage both private and public cloud services. Docker containers form the basic infrastructure of the platform.  Modern web development technologies are used to implement the platform.


​This activity supported in part by MnDRIVE Global Food Ventures, University of Minnesota