Relaunching GEMS Informatics Exchange APIs

Services
Written by
Kevin Silverstein and Phil Pardey

APIs: Now well-documented and much easier to use

One of the big frustrations in using computing to solve large, multidisciplinary challenges is managing data sets from different disciplines. Often, you have to go to each individual site and download the entire dataset. Then you have to parse out the subset of data fields you want within the geographies, spatial resolutions and time periods you care about. It is still the case that a few groups provide their data in the form of an Application Programmer Interface (API), where the data are served in a structured form with clear metadata documentation. Data can be sliced and diced how you like, selecting subsets of geography, time, and variables of interest. Once you sign up and obtain an API key, it just takes a few lines of code in Python or R to establish a connection and query at will!

GEMS has been building out a portfolio of APIs since 2021 across a range of useful datasets seeking to span the full Genetics x Environment x Management x Socioeconomic data landscape. Those who tried GEMS Exchange before will know that we used to have a middle layer managed by RapidAPI. Users found that cumbersome and confusing, so we are now using our own Apache APISIX server within our own web pages to serve you your key and monitor usage. We’re confident that your experience will be super easy this time around. Let’s get you started!

First, check out which APIs might interest you at our GEMS Exchange page. To obtain your API key simply click here for key. (Note you will need to have a Globus.org account, which is free – or you can connect via your academic institution, Google account, or ORCID). Once you know which APIs interest you, explore our collection of Jupyter notebooks in Github that give you practical guidance on how to use them. Many of the APIs we offer use the GEMS Grid which help ensure they are interoperable. And the GEMS Grid itself has recently been made open source, so you can place your own data sets on the Grid and interoperate with the community.

We are always happy to hear of useful datasets that could be added to the GEMS gridded collection in Exchange, so by all means reach out with suggestions or queries here.


​This activity supported in part by MnDRIVE Global Food Ventures, University of Minnesota

The GEMS Informatics Grid Goes Open Source

Written by
Kevin Silverstein

We are delighted to announce that we have just released the GEMS Grid code library, where the code is under the open source Apache 2.0 license, which allows anyone to use the code for commercial or non-commercial purposes – you simply need to provide attribution to GEMS Informatics when you use or modify it.

Just before we at GEMS Informatics started developing Application Programmer Interfaces (APIs) in agriculture for GEMS Exchange, GEMS geospatial expert Jeffery Thompson worked with others in the GEMS team and colleagues at NSIDC to develop the GEMS Grid, a hierarchical discrete global gridding system. This Grid has allowed us to provide data sets at different resolutions ranging from 36 km to 1 m, and still have them remain functionally interoperable. The interoperability is possible because we have written the code to allow users to project data onto the grid, aggregate data to coarser resolutions, and, notably, also disaggregate data to finer resolutions. The latter operation is ordinarily a difficult problem, but is made easier, as I discuss below, since we enable the users of our code to thoughtfully address it in a standardized, replicable way.

Many problems in agriculture (e.g., understanding the spatial location of crop production) require equal area parcels of land to do proper calculations. Working with strict lat-lon coordinates won’t suffice as areas near the equator are significantly different in size as areas near the poles. The GEMS Grid preserves equal-area assumptions as it divides land, so you can do these calculations with confidence, and preserve aggregation-disaggregation consistency in the data, even if you are not a GIS expert.

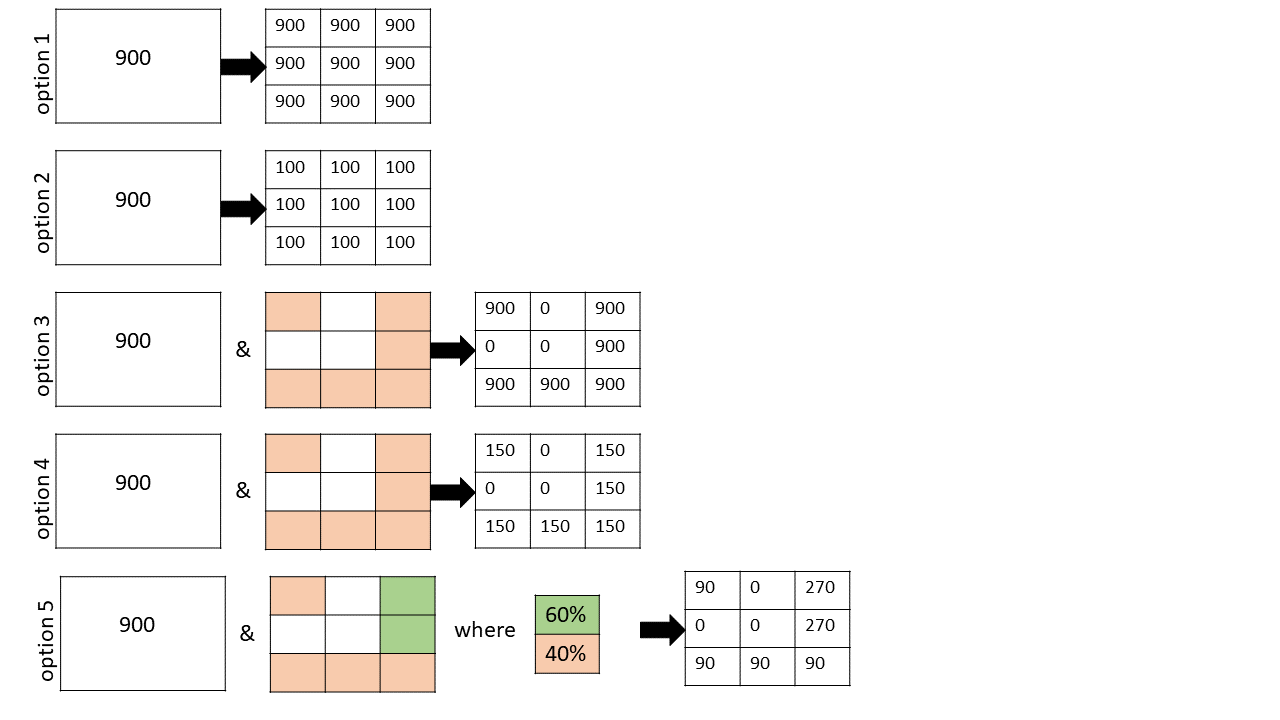
Pictorial description of the 5 options for disaggregation on the GEMS Grid

So let’s look at the 5 options for disaggregation that GEMS geospatial developer Olena Boiko included in the GEMS grid toolbox, schematically described in the figure she developed above.

Option 1. Value transference. 
In this case, if you were to subdivide a 3 km2 resolution grid cell into 9 x 1 km2 cells, this option would be appropriate for any value that is deemed roughly constant throughout the area applied. Examples would be rainfall in inches or grain yield in bushels / acre.

Option 2. Even value division. 
Sometimes the quantity measured in a cell represents a cumulative value for the area in which it is reported. In this case, if the parent cell is homogenous, then splitting it up into 9 equal-area pieces would require that you divide the value in each equivalent cell by a factor of 9. Examples where this selection makes sense include grain production in bushels, crop acreage, and population.

Option 3. Value transference with a mask. 
This one is similar to Option 1 except we are no longer making the assumption that the distribution of values in the parent cell is spatially homogeneous. For example suppose you were measuring grain yield, but you knew that 3 of your nine cells had buildings occupying them (see white areas in the Figure). In this case you only transfer your values to 6 remaining cells (colored peach) that have arable land. Cells are binary with this option (i.e., either allowed a value or not).

Option 4. Even value division with a mask. 
Analogously, you can mask out cells in the value division case when you know that your daughters cells are not all equal. This is just like the case in Option 3, except you divide your parent-cell value evenly by the number of viable daughter cells. In this pictorial example, there are 6 viable daughter cells, so each gets a value of 900/6 = 150. This would be appropriate if you were computing grain production in bushels and you had a total value that needed to be split up across the 6 arable daughter parcels.

Option 5. Flexible division with a mask. 
This scenario is the most flexible, and allows the user to create a master mask with arbitrary weights at each daughter cell. It allows you to block off daughter cells entirely, and prescribe the relative weights of all remaining daughter cells. This is ideal for situations where you are allocating crop distributions and you want to avoid certain land use features (e.g., lakes, forests, housing) and probabilistically distribute the remaining crop areas (e.g., with higher probability near soils with a high SSURGO National Commodity Crop Productivity Index).

I’m confident these flexible disaggregation tools will provide much easier, more accurate, and replicable solutions for your particular spatial analytic problem. So please give them a try!


​This activity supported in part by MnDRIVE Global Food Ventures, University of Minnesota

Agri-Food Market Intelligence Tool for Malawi

Categories
Services
Written by
Phil Pardey and Ali Joglekar

In 2019, we began working on a project in partnership with the Centre for Agricultural Transformation to accelerate the transformation of Malawian agricultural production away from tobacco to other sustainable agri-food value chains that can provide positive economic and livelihood outcomes. Growing agri-food markets requires farmers to have more affordable and timely access to the right farm inputs, financial services, and expanding fresh and processed commodity markets at home and abroad. The obvious initial questions were which value chains to prioritize, and where in the country does one target interventions to best meet growing urban and export opportunities? But where does one find the requisite market intelligence?

While there are plenty of one-off, glossy, consultancy reports available for specific value chains in Malawi, they left us frustrated. The types of data reported are useful in providing broad contextual information but make it difficult to reach actionable conclusions. By their very nature, these reports provide static snapshots that don’t lend themselves to more user-driven questions.

Not All Farmers Are the Same

Farmers, and the farms they manage, vary in a myriad of ways that have important market development implications. Many Malawian farmers are smallholders, but there are mid-to-larger sized farms as well. They grow different crops, in different locations, with different degrees of input and output market participation, and vary in their resilience to climate and market risks. Identifying and then targeting appropriate technology, innovations and other investments towards the right market segment is key to agricultural transformation.
 

An ox pulling a red, wooden cart along a rural dirt road in Malawi with two riders.


The Market Segmentation Tool (otherwise known as MST) is a user-driven, digital “market intelligence” tool to better inform value-chain investments. It is designed for all sorts of agri-food market participants in Malawi, notably farmer-based organizations, non-profit agencies, for-profit firms, startups and established enterprises, NGOs, government, and research organizations. This first-in-class tool was designed by the GEMS Informatics team at the University of Minnesota to fill an important agricultural development void. It allows users to better tailor their products and services to the unique needs of the particular on- and post-farm market segments they seek to serve.

Intuitive Interactive Intelligence

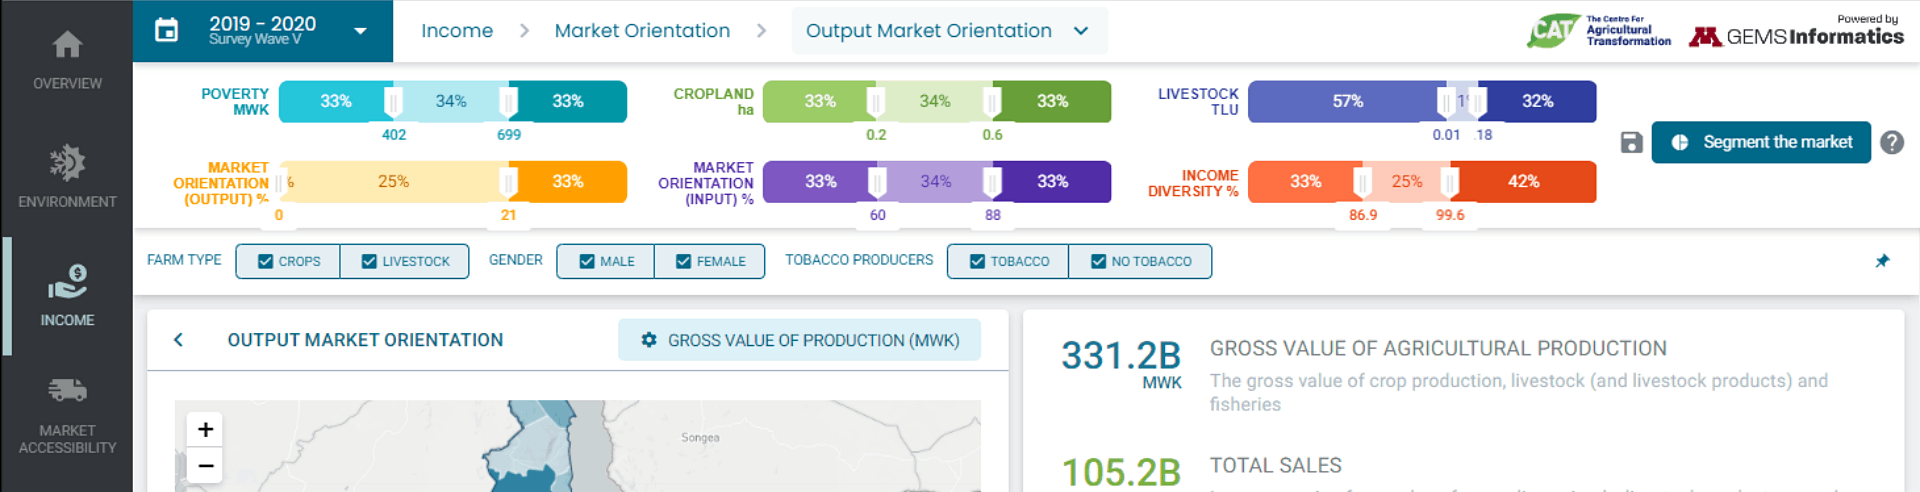
Available through a publicly available URL, MST uses sophisticated on-the-fly analytics to allow non-technical users to quickly interrogate large, complex, and disparate data on the environment, income, market accessibility and agricultural production. MST draws on more than 100 relevant variables in a spatially explicit way and presents insights through simple charts, graphs and mapped representations. These customizable figures can be saved via a screenshot and the underlying data are available for download in a .csv format at a district-level.

For example, if a user was interested in exploring the production practices of smallholders, rather than simply looking at farmers who cultivate less than 1 hectare of land, users can create a more nuanced smallholder definition. Within MST agricultural households can be readily categorized based on up to 6 segmentation variables: poverty, cropland assets, livestock assets, output market orientation, input market orientation, and income diversity. For instance, users could characterize a market cohort defined by agricultural households that cultivate between 0.5 and 1 hectare and have an average per capita consumption expenditure between 400 and 800 Kwacha per day.

Once the market cohorts are defined, the user then navigates through the dashboard to explore the historic production, market orientation and income diversification practices of households that meet the criteria defined by our poverty and cropland thresholds. Data are displayed in multi-level geographical maps as well as infographic charts, many of which are interactive, and all of which can be filtered by farm type, gender, and tobacco producers across three World Bank LSMS survey waves (2010-11, 2015-16, and 2019-20).

Spatially explicit market intelligence is further enhanced with grid-based data on market access and agro-ecological information such as time to market, road density, population density, agro-ecological zones, climate variables (including temperature and precipitation) and soil types, which can be accessed through the environment and market access modules.

Bottom Line. Our tool enables users to identify which farmers, for which markets, in which locales, make the most sense for their particular value-chain investments.

MST can be explored at agroinformatics and user help videos are available at our YouTube channel.

Feel free to contact us if you have any questions or comments on the tool, which has been designed to be extensible to additional variables and other countries with the ability to accommodate open and private data.

This posting was produced as part of the Centre for Agricultural Transformation, an effort led by Land O’Lakes Venture37 and funded with a grant from the Foundation for a Smoke-Free World, Inc. (“FSFW”), a US nonprofit 501(c)(3) private foundation. The contents, selection and presentation of facts, as well as any opinions expressed herein, are the sole responsibility of the authors and under no circumstances should they be regarded as reflecting the positions of FSFW.


​This activity supported in part by MnDRIVE Global Food Ventures, University of Minnesota