Relaunching GEMS Informatics Exchange APIs

Services
Written by
Kevin Silverstein and Phil Pardey

APIs: Now well-documented and much easier to use

One of the big frustrations in using computing to solve large, multidisciplinary challenges is managing data sets from different disciplines. Often, you have to go to each individual site and download the entire dataset. Then you have to parse out the subset of data fields you want within the geographies, spatial resolutions and time periods you care about. It is still the case that a few groups provide their data in the form of an Application Programmer Interface (API), where the data are served in a structured form with clear metadata documentation. Data can be sliced and diced how you like, selecting subsets of geography, time, and variables of interest. Once you sign up and obtain an API key, it just takes a few lines of code in Python or R to establish a connection and query at will!

GEMS has been building out a portfolio of APIs since 2021 across a range of useful datasets seeking to span the full Genetics x Environment x Management x Socioeconomic data landscape. Those who tried GEMS Exchange before will know that we used to have a middle layer managed by RapidAPI. Users found that cumbersome and confusing, so we are now using our own Apache APISIX server within our own web pages to serve you your key and monitor usage. We’re confident that your experience will be super easy this time around. Let’s get you started!

First, check out which APIs might interest you at our GEMS Exchange page. To obtain your API key simply click here for key. (Note you will need to have a Globus.org account, which is free – or you can connect via your academic institution, Google account, or ORCID). Once you know which APIs interest you, explore our collection of Jupyter notebooks in Github that give you practical guidance on how to use them. Many of the APIs we offer use the GEMS Grid which help ensure they are interoperable. And the GEMS Grid itself has recently been made open source, so you can place your own data sets on the Grid and interoperate with the community.

We are always happy to hear of useful datasets that could be added to the GEMS gridded collection in Exchange, so by all means reach out with suggestions or queries here.


​This activity supported in part by MnDRIVE Global Food Ventures, University of Minnesota

The GEMS Informatics Grid Goes Open Source

Written by
Kevin Silverstein

We are delighted to announce that we have just released the GEMS Grid code library, where the code is under the open source Apache 2.0 license, which allows anyone to use the code for commercial or non-commercial purposes – you simply need to provide attribution to GEMS Informatics when you use or modify it.

Just before we at GEMS Informatics started developing Application Programmer Interfaces (APIs) in agriculture for GEMS Exchange, GEMS geospatial expert Jeffery Thompson worked with others in the GEMS team and colleagues at NSIDC to develop the GEMS Grid, a hierarchical discrete global gridding system. This Grid has allowed us to provide data sets at different resolutions ranging from 36 km to 1 m, and still have them remain functionally interoperable. The interoperability is possible because we have written the code to allow users to project data onto the grid, aggregate data to coarser resolutions, and, notably, also disaggregate data to finer resolutions. The latter operation is ordinarily a difficult problem, but is made easier, as I discuss below, since we enable the users of our code to thoughtfully address it in a standardized, replicable way.

Many problems in agriculture (e.g., understanding the spatial location of crop production) require equal area parcels of land to do proper calculations. Working with strict lat-lon coordinates won’t suffice as areas near the equator are significantly different in size as areas near the poles. The GEMS Grid preserves equal-area assumptions as it divides land, so you can do these calculations with confidence, and preserve aggregation-disaggregation consistency in the data, even if you are not a GIS expert.

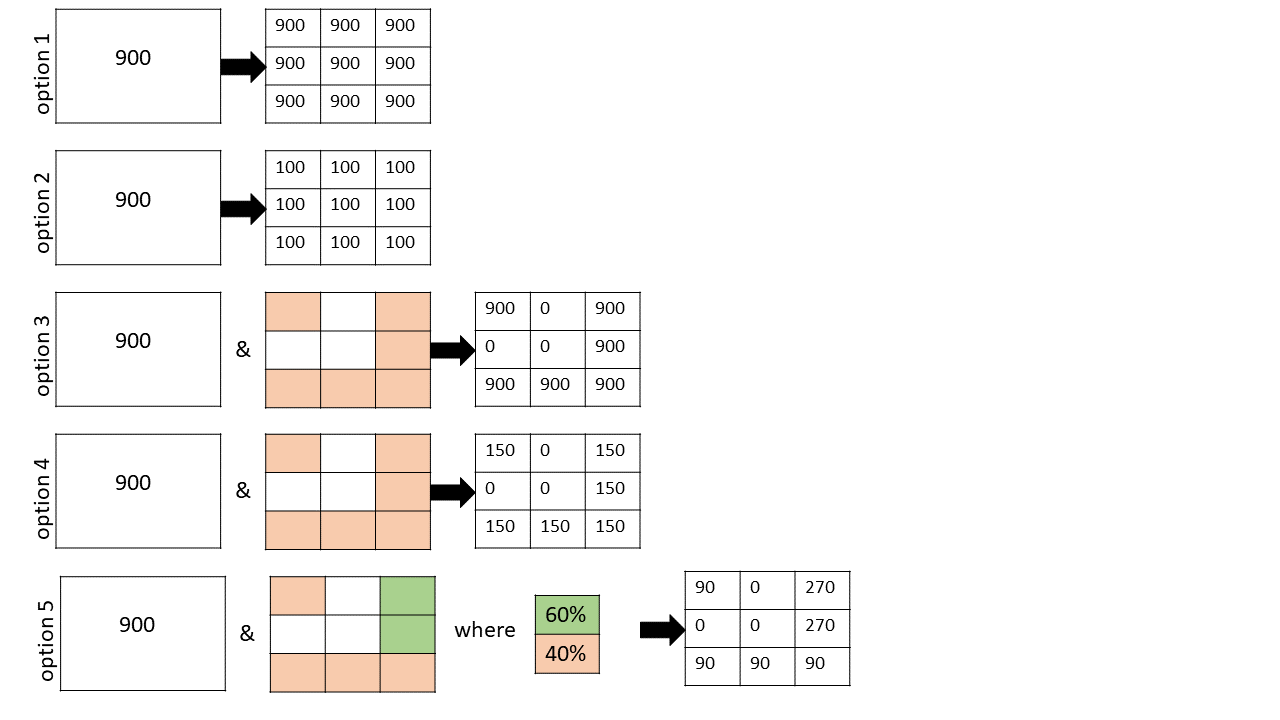
Pictorial description of the 5 options for disaggregation on the GEMS Grid

So let’s look at the 5 options for disaggregation that GEMS geospatial developer Olena Boiko included in the GEMS grid toolbox, schematically described in the figure she developed above.

Option 1. Value transference. 
In this case, if you were to subdivide a 3 km2 resolution grid cell into 9 x 1 km2 cells, this option would be appropriate for any value that is deemed roughly constant throughout the area applied. Examples would be rainfall in inches or grain yield in bushels / acre.

Option 2. Even value division. 
Sometimes the quantity measured in a cell represents a cumulative value for the area in which it is reported. In this case, if the parent cell is homogenous, then splitting it up into 9 equal-area pieces would require that you divide the value in each equivalent cell by a factor of 9. Examples where this selection makes sense include grain production in bushels, crop acreage, and population.

Option 3. Value transference with a mask. 
This one is similar to Option 1 except we are no longer making the assumption that the distribution of values in the parent cell is spatially homogeneous. For example suppose you were measuring grain yield, but you knew that 3 of your nine cells had buildings occupying them (see white areas in the Figure). In this case you only transfer your values to 6 remaining cells (colored peach) that have arable land. Cells are binary with this option (i.e., either allowed a value or not).

Option 4. Even value division with a mask. 
Analogously, you can mask out cells in the value division case when you know that your daughters cells are not all equal. This is just like the case in Option 3, except you divide your parent-cell value evenly by the number of viable daughter cells. In this pictorial example, there are 6 viable daughter cells, so each gets a value of 900/6 = 150. This would be appropriate if you were computing grain production in bushels and you had a total value that needed to be split up across the 6 arable daughter parcels.

Option 5. Flexible division with a mask. 
This scenario is the most flexible, and allows the user to create a master mask with arbitrary weights at each daughter cell. It allows you to block off daughter cells entirely, and prescribe the relative weights of all remaining daughter cells. This is ideal for situations where you are allocating crop distributions and you want to avoid certain land use features (e.g., lakes, forests, housing) and probabilistically distribute the remaining crop areas (e.g., with higher probability near soils with a high SSURGO National Commodity Crop Productivity Index).

I’m confident these flexible disaggregation tools will provide much easier, more accurate, and replicable solutions for your particular spatial analytic problem. So please give them a try!


​This activity supported in part by MnDRIVE Global Food Ventures, University of Minnesota

Innovation in Assessing Soybean Aphid Risk

Written by
Yuan Chai

We’re thrilled to announce that GEMS is leading a novel 2-year project funded by the Minnesota Invasive Terrestrial Plants and Pests Center (MITPPC) with support from the Minnesota Environment and Natural Resources Trust Fund.  "Linking soybean aphid losses to technology investment decisions"  a transformative project aimed at developing a flexible, evidence-based, bio-economic evaluation workflow to characterize the long-term, probabilistic extent of soybean aphid damage throughout Minnesota.

Our Mission: A Repeatable and Extensible Pest Risk Assessment Tool to Inform Decision Making

Soybean aphids have emerged as a significant arthropod pest impacting soybeans in North America since 2000. However, a systematic effort to collect, analyze, and report on yield losses caused by this pest in farmers' fields has been notably absent, particularly concerning the longer-term, state-wide perspectives that are crucial for strategic R&D and policy decisions.

Our goal is to comprehensively assess the risk posed by the soybean aphid for the state of Minnesota to help inform decisions regarding research investment and pest mitigation strategies. Our evaluation framework breaks new ground by factoring in both the spatially- and temporally-variable pest risk elements that many prior efforts have overlooked. Our flexible evaluation approach is designed to deal with either data-poor or data-rich scenarios while taking into account the geographical extent, frequency, and severity of damage to undertake regional and meso-scale risk assessments. 

Our project, 'Linking Soybean Aphid Losses to Technology Investment Decisions,' is breaking new ground by developing a flexible, evidence-based framework for estimating crop losses that account for the dynamic nature of pest risks. Through interdisciplinary collaboration, we're forging a path to innovative solutions in agriculture.

-Yuan Chai

Forward-Looking Impact: Shaping Tomorrow's Risk Management Strategies

This project entails close collaboration between the GEMS Informatics Center (PI Dr. Philip Pardey and co-PI Dr. Yuan Chai) and the Department of Entomology (co-PI Dr. Robert Koch), leveraging a spectrum of expertise in pest, crop, and socio-economics. With cutting-edge data and analytics support, we're developing a data-driven, replicable, and extensible framework for meso-scale ex-ante pest risk evaluation of soybean aphids. The project's impact stretches far beyond the laboratory, resonating with stakeholders invested in the field of crop pest management. Our findings will empower MITPPC, state government agencies, academic units, and crop commodity groups to strategically allocate resources for targeted investments in pest management strategies. Moreover, our approach is designed to be extendable to a wide range of crop pest and disease challenges in Minnesota and beyond.

Join Us on this Journey! 

Join us on this transformative journey, where our collaborative effort is poised to shape the future of agricultural resilience and resource optimization decisions. Stay tuned for updates on findings, methodologies, and the broader implications of our work by signing up for the MITPPC newsletter and by visiting our project page. Together, let's revolutionize the landscape of agricultural research and pest management! ??


Photo Attribution: Christina DiFonzo, Michigan State University / © Bugwood.org


​This activity supported in part by MnDRIVE Global Food Ventures, University of Minnesota
Water Resources and Sensing Conference Session

Written by
Kevin Silverstein

Assessing BMP Effectiveness for Water Quality Outcomes with Remote Sensing

Virtually everyone in Minnesota and bordering states whose profession has a direct stake in Water Conservation assembled in Downtown St. Paul’s RiverCentre October 17-18 for the annual Water Resources Conference. I had the honor of chairing a Special Session at the conference titled “Assessing BMP Effectiveness for Water Quality Outcomes with Remote Sensing.” The session featured two very foundational efforts that we are attempting to bridge together in partnered research at GEMS: (1) The Minnesota Department of Agriculture’s (MDA) Minnesota Agricultural Water Quality Certification Program (MAWQCP), directed by Brad Jordahl Redlin, and (2) the Department of Forest Resources’ remote-sensed Water Quality assessment for our 10,000+ lakes, led by Leif Olmanson.


The 90-minute session was organized so that each of the three speakers (one had dropped out last minute for logistical reasons) had 20 minutes to speak plus two minutes for burning questions. At the end the audience had 15 minutes for questions with the entire panel of speakers. There were about 30 very inquisitive people in the audience, who peppered the speakers with questions throughout.

Updates on the MDA’s certification program

Brad Jordahl Redlin kicked off the session with an outstanding talk that outlined the principles on which the certification program he founded and directs was created, and highlighted the progress that has been made. Literally over a million acres have now been certified, spread across over 1400 producers. In exchange for regulatory certainty for a period of time, these producers allow his government agency to (1) assess their farm practices, (2) suggest new management practices (sometimes with additional incentives such as subsidized equipment from a grant), and (3) carry out audits of their new practices. The program, which has been operational for nearly a decade, is well beyond the stage of corralling early-adopters. New participants span the spectrum of producer demographics in age, farm size, and more.
 

Brad Jordahl Redlin of the MDA talking at the WRC Special Session

Scaling lake quality measurement

Leif Olmanson stepped up to review an activity that he first spearheaded twenty years ago – using remote sensing to measure the water quality of Minnesota lakes. In the interim, he has overseen steady progress using new generations of satellites (from Landsat to Sentinel), multiple metrics (clarity, chlorophyll, organic matter), and the frequency of data reporting (from once every 5 years to ~weekly lake snapshot and monthly pixel-level composites of all 10,000+ lakes). Data is made available to the casual user via a friendly Lake Browser interface, and in numeric form pixel-by-pixel for data wizards on GEMS Exchange.
 

Leif Olmanson of the UMN Dept. of Forest Resources talking at the WRC Special Session

GEMS bridging the two programs

David Porter rounded out the session discussing the improvements he has made in creating algorithms that properly remove clouds and aerosols from the satellite images. This is a prerequisite for feeding all of the regularly spaced (~5 day) images of a field through a growing season into a sophisticated Recurrent Neural Network (RNN, a type of Machine Learning algorithm) that his colleague Anubha Agrawal has been preparing. As described in this case study, David, Anubha, and I intend to use the RNN trained on known, certified management practices (e.g., strip till / no till, cover crops) from the MAWQCP to make a prediction of what practices growers are making on uncertified farmland. We then will trace these producer fields to the downstream lakes in each watershed, and see what covariates (e.g., slope, soil type, distance to waterway) affect the correlation of % farm practice adoption vs. downstream lake quality in a watershed.


​This activity supported in part by MnDRIVE Global Food Ventures, University of Minnesota

CyberTraining for Agri-Food Scientists

Services
Written by
Kevin Silverstein

GEMS’s new NSF award

Training ag and food scientists how to make the most out of supercomputers

Do you write code (maybe in R, maybe in Python)? Maybe you’re an agri-food scientist in a lab, or in a similar field in industry. Perhaps you’ve tried to write some code to get your work done, figuring you can run it on your laptop. But when you churn on that data you find after two weeks of keeping your laptop open to run the code that it’s probably not going to finish any time soon… Epiphany. You need to do this in a smarter way! Well you’re in luck – GEMS was just awarded a grant from NSF titled “Cyber Training: Pilot -- Breaking the Compute Barrier, Upskilling Agri-Food Researchers to Utilize HPC Resources” and you are exactly the audience we wish to reach with the courses we are developing.

The Team

The course material is being developed by an interdisciplinary team including:

  • Instructor Joe Axberg, who works on supercomputing infrastructure by day but is also a part-time instructor after hours in the IT Infrastructure Program in the College of Continuing and Professional Studies.
  • Project mastermind, Ali Joglekar, an agricultural economist by trade with real-world experience working with smallholder farmers in East Africa
  • Kevin Silverstein, a cofounder of GEMS Informatics and expert bioinformaticist with specialties in molecular plant-microbe interactions and large-scale informatics problems
  • Jesse Erdmann, systems architect and guiding force behind much of the inner workings of GEMS infrastructure.
  • Ben Lynch, Director of MSI, with a long track record of innovating in the scientific computing domain

Scope

The proposal identifies 7 separate course modules that each contain a significant number of concepts, representing a broad swath of content to help up-skill agri-food researchers to use HPC:

  1. Introduction to High-Performance Computing (HPC) for Agri-Food Researchers
  2. Introduction to Cloud Computing for Agri-Food Researchers
  3. Hands-On: Use HPC to Analyze More Data and Faster
  4. Leveling-Up I: Expanding HPC Skills for Agri-Food Research
  5. Computer Science for the Agri-Food Researcher
  6. Leveling-Up II: Advanced HPC Concepts
  7. High Performance Workstations and Servers for Agri-Food Researchers

It is expected that the number of modules proposed and the content within each module may change as we build out the course and modules during the development phase(s). The goal of our iterative course development process is to refine this broad set of concepts and craft cohesive modules each with a duration of 2-6 hours of lecture materials (depending on the module). Some modules will span multiple weeks. Several rounds of purposeful learner feedback is integral to our course development process. 

The course modules will also be “stackable” allowing learners to have some ability to “pick and choose” modules in line with their competencies and interests.

Figure showing timeline from course development starting August 2023, versioning and full course deliverylivery

Timeline for delivery

As the diagram indicates, we are planning to offer each HPC for Agri-Food Researchers course over a 10-12 week period of time. The proposed course structure, in line with our other GEMS Learning offerings, includes asynchronous and synchronous instructional elements. Lecture materials will be delivered via videos and readings, which students are expected to review ahead of the weekly 1.5 hour class session. This instructor-led class time is primarily dedicated to synthesizing and reviewing the content being taught. To solidify learning objectives, students will be expected to engage in regular assessments and hands-on learning exercises outside of the weekly class session. We estimate that students will be responsible for 6+ hours/week of self-directed learning activities, depending on their skill-levels.

You can influence our content!

The good news is we are still in development, so you can influence these course offerings. Please fill out this survey now to make your voice heard!


​This activity supported in part by MnDRIVE Global Food Ventures, University of Minnesota

Nudging Farmers to Lower Nitrogen Pollution

Written by
Yuan Chai, David Pannell and Philip Pardey

Behavioral economists are studying “nudges” to prompt behavior change in agriculture. Accounting for production economics can help make nudges more effective for reducing agricultural run-off.

A banner showing water runoff from a corn field
Runoff of nutrients from farm fields.
Photo Credit: Lynn Betts

Water pollution caused by agricultural nitrogen runoff is a pervasive problem worldwide. In a recently published paper (Food Policy), GEMS researchers (Yuan Chai and Philip Pardey) teamed up with University of Western Australia collaborator (David Pannell) to provide a new slant on this age-old problem. Combining insights from both production economics and behavioral science opens up new and practical avenues for nudging farmers towards eco-friendly practices that can mitigate water pollution. 


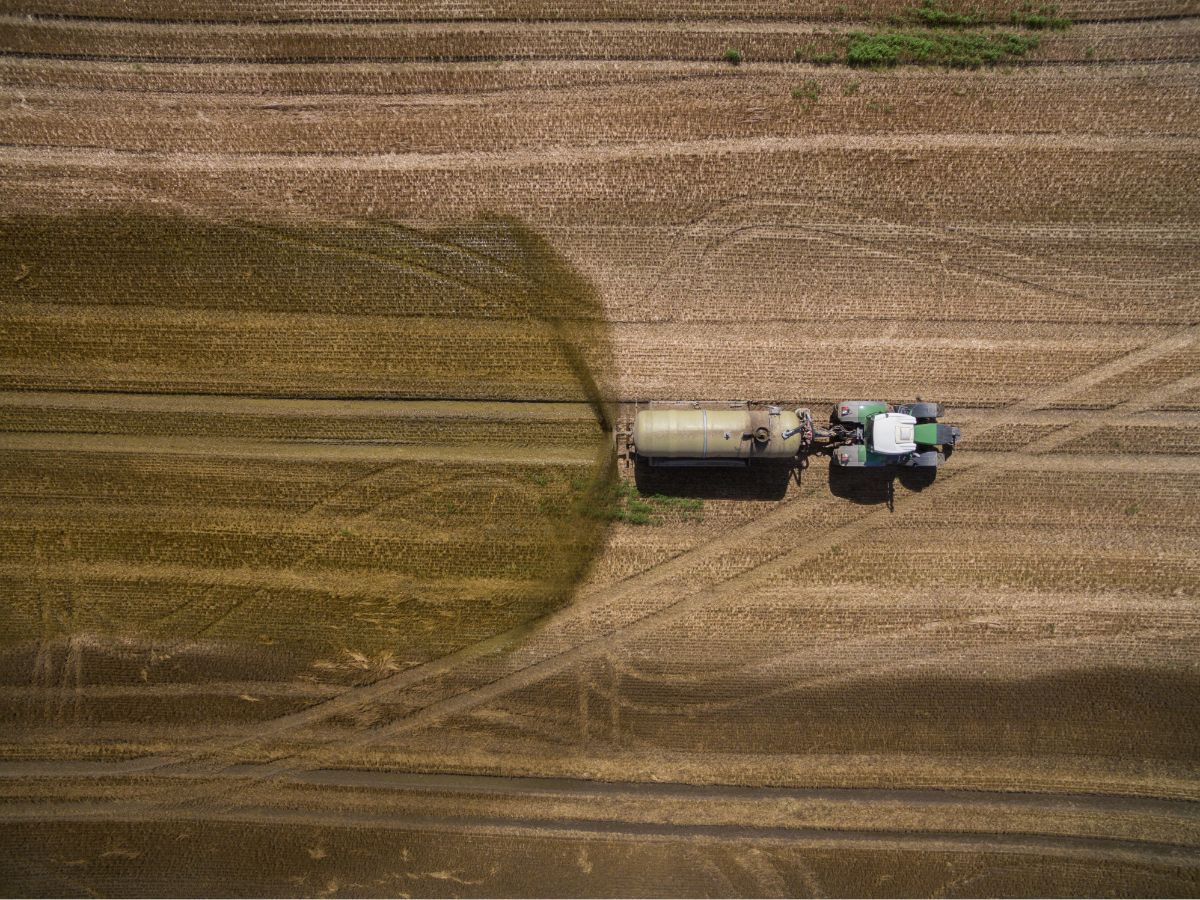
container trailers of liquid nitrogen

Production Economics Insights

The authors highlight three key empirical findings that offer opportunities to reshape farming practices and reduce nitrogen pollution. First, many farmers tend to apply more nitrogen than necessary, driven by yield maximizing or other motives. This can lead farmers to use more fertilizer than is economically optimal, which not only incurs avoidable costs but also exacerbates the water pollution problem. Second, farmers may imagine that, contrary to the evidence, using more fertilizer is a risk-reducing strategy. Thirdly, the profit-to-fertilizer-rate relationship is flat near the optimum, suggesting that farmers can curtail their fertilizer usage without incurring significant, if any, private costs (through foregone income).

Nudges

Leveraging these three insights, the authors draw on emerging findings from behavioral economics to identify a number of potentially transformative approaches to curbing agricultural pollution. The authors make specific suggestions for ways in which behavioral science could contribute in these areas, including understanding farmers’ perceptions about nitrogen, yield and profit (detecting biases), understanding the influences of these biases on behavior, understanding farmers’ perceptions of and preferences for different policy responses, and designing behavioral nudges that capitalize on the specific insights we have highlighted regarding the production economics of nitrogen fertilizer. Nudges could include strategies that aim to correct biases in perceptions (e.g., about yield increases or risk reductions from applying N),or tap into social and psychological factors that influence farmers’ decision making.

Behavioral changes that are deemed nudgeable (i.e., where farmers bear little or no cost) have a lot of merit. The nudges revealed through this research could go a long way to cleaning up water bodies in ways that do not undermine food security or farmer livelihood concerns: a rare win-win result.


​This activity supported in part by MnDRIVE Global Food Ventures, University of Minnesota

Agri-Food Market Intelligence Tool for Malawi

Categories
Services
Written by
Phil Pardey and Ali Joglekar

In 2019, we began working on a project in partnership with the Centre for Agricultural Transformation to accelerate the transformation of Malawian agricultural production away from tobacco to other sustainable agri-food value chains that can provide positive economic and livelihood outcomes. Growing agri-food markets requires farmers to have more affordable and timely access to the right farm inputs, financial services, and expanding fresh and processed commodity markets at home and abroad. The obvious initial questions were which value chains to prioritize, and where in the country does one target interventions to best meet growing urban and export opportunities? But where does one find the requisite market intelligence?

While there are plenty of one-off, glossy, consultancy reports available for specific value chains in Malawi, they left us frustrated. The types of data reported are useful in providing broad contextual information but make it difficult to reach actionable conclusions. By their very nature, these reports provide static snapshots that don’t lend themselves to more user-driven questions.

Not All Farmers Are the Same

Farmers, and the farms they manage, vary in a myriad of ways that have important market development implications. Many Malawian farmers are smallholders, but there are mid-to-larger sized farms as well. They grow different crops, in different locations, with different degrees of input and output market participation, and vary in their resilience to climate and market risks. Identifying and then targeting appropriate technology, innovations and other investments towards the right market segment is key to agricultural transformation.
 

An ox pulling a red, wooden cart along a rural dirt road in Malawi with two riders.


The Market Segmentation Tool (otherwise known as MST) is a user-driven, digital “market intelligence” tool to better inform value-chain investments. It is designed for all sorts of agri-food market participants in Malawi, notably farmer-based organizations, non-profit agencies, for-profit firms, startups and established enterprises, NGOs, government, and research organizations. This first-in-class tool was designed by the GEMS Informatics team at the University of Minnesota to fill an important agricultural development void. It allows users to better tailor their products and services to the unique needs of the particular on- and post-farm market segments they seek to serve.

Intuitive Interactive Intelligence

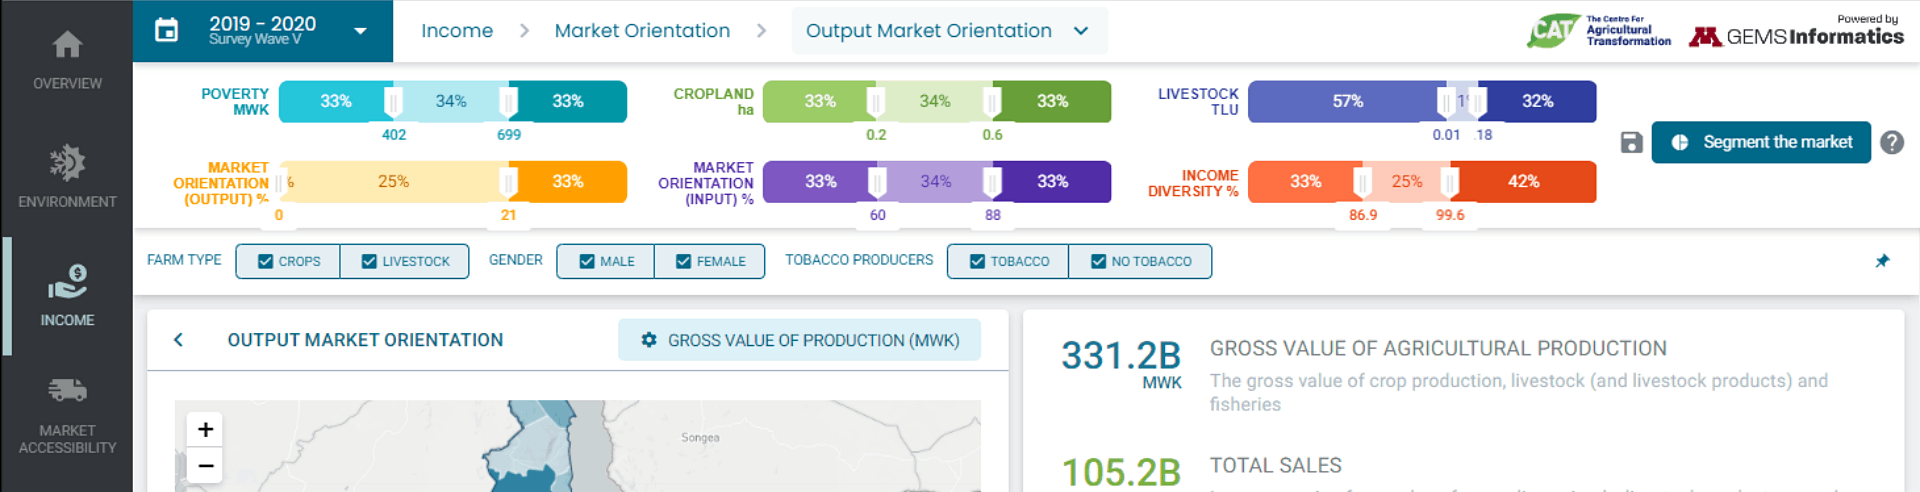
Available through a publicly available URL, MST uses sophisticated on-the-fly analytics to allow non-technical users to quickly interrogate large, complex, and disparate data on the environment, income, market accessibility and agricultural production. MST draws on more than 100 relevant variables in a spatially explicit way and presents insights through simple charts, graphs and mapped representations. These customizable figures can be saved via a screenshot and the underlying data are available for download in a .csv format at a district-level.

For example, if a user was interested in exploring the production practices of smallholders, rather than simply looking at farmers who cultivate less than 1 hectare of land, users can create a more nuanced smallholder definition. Within MST agricultural households can be readily categorized based on up to 6 segmentation variables: poverty, cropland assets, livestock assets, output market orientation, input market orientation, and income diversity. For instance, users could characterize a market cohort defined by agricultural households that cultivate between 0.5 and 1 hectare and have an average per capita consumption expenditure between 400 and 800 Kwacha per day.

Once the market cohorts are defined, the user then navigates through the dashboard to explore the historic production, market orientation and income diversification practices of households that meet the criteria defined by our poverty and cropland thresholds. Data are displayed in multi-level geographical maps as well as infographic charts, many of which are interactive, and all of which can be filtered by farm type, gender, and tobacco producers across three World Bank LSMS survey waves (2010-11, 2015-16, and 2019-20).

Spatially explicit market intelligence is further enhanced with grid-based data on market access and agro-ecological information such as time to market, road density, population density, agro-ecological zones, climate variables (including temperature and precipitation) and soil types, which can be accessed through the environment and market access modules.

Bottom Line. Our tool enables users to identify which farmers, for which markets, in which locales, make the most sense for their particular value-chain investments.

MST can be explored at agroinformatics and user help videos are available at our YouTube channel.

Feel free to contact us if you have any questions or comments on the tool, which has been designed to be extensible to additional variables and other countries with the ability to accommodate open and private data.

This posting was produced as part of the Centre for Agricultural Transformation, an effort led by Land O’Lakes Venture37 and funded with a grant from the Foundation for a Smoke-Free World, Inc. (“FSFW”), a US nonprofit 501(c)(3) private foundation. The contents, selection and presentation of facts, as well as any opinions expressed herein, are the sole responsibility of the authors and under no circumstances should they be regarded as reflecting the positions of FSFW.


​This activity supported in part by MnDRIVE Global Food Ventures, University of Minnesota

Become a Data Scientist for Digital Agri

Services
Written by
Kevin A. T. Silverstein

What skills should you be building for a career as a data scientist in Digital Agriculture?

Everything we do has a spatial and temporal component. These days GIS skills are a big plus!

I often have students come to me saying “I’m passionate about the agri-food sector and I want to do data science. What skills do I need to land a satisfying job, and ultimately a career, in this area?” So I figured I’d take the opportunity to share what I typically say to them here, for the benefit of all those out there with similar goals and interests. Key items are in bold.

First off, there is so much unstructured data out there, in disparate formats and locations that you aren’t going to get far without a programming language under your belt. And in this field, that really boils down to Python and/or R. Sure, Chat-GPT can write code, but trust me, it’s not there yet.

Next, everything we do has a spatial and temporal component. These days GIS skills are a big plus! You don’t have to be a GIS expert, but you should know what a coordinate reference system and datum are, understand the limitations and practicalities of aggregation and disaggregation to different levels of resolution, and be facile with vector and raster manipulations.

Data science applied to any domain involves statistics and modeling. Moving beyond point estimates with p-values and understanding Bayesian statistics will get you far. And an understanding of databases (e.g., relational, graph, or columnar) can also be useful.

Finally, many datasets are incredibly large, so analyses often can’t be performed on your laptop. So familiarity with doing analyses on High-Performance Computing (HPC) infrastructure can be critical. These systems have mechanisms in place for you to schedule jobs to be run across multiple processors in tandem with other people’s jobs, and there are conventions and rules of etiquette for that.

Depending on the positions you have in your wish list, you may want to be sure to have either a Masters level degree or Ph.D. Masters should suffice if you’re happy to have someone else identify and devise the scope of the problems you work on. If you want to do pure R&D and define your own problems, a Ph.D. will likely be necessary.

If you're lacking some of these skills or qualifications, there are numerous data science degrees offered across the country, as well as short instructional modules such as those included in GEMS Learning.


​This activity supported in part by MnDRIVE Global Food Ventures, University of Minnesota

A Look at Wheat Biodiversity & Genetic Gain

A Cross-Border Research Partnership with the University of Saskatchewan


Wheat Varietal Change in the US and Canada

A map showing the locations of wheat productions in the US and Canada

The United States and Canada are both major wheat producers, with total harvested areas in 2021 respectively ranked 4th and 7th globally (FAOSTAT, 2023). Advancements in crop breeding and agricultural practices have led to steady productivity gains in the production of high-quality wheat varieties in both countries, positioning North America as a leading force in the world’s wheat market. Facing the challenges of climate change, increasing land and water scarcity, and emerging pest and disease threats, the resilience and productivity of wheat crops are of paramount importance in ensuring a stable and secure food supply for the continent and the world.

Using a century of data on commercial wheat crops in the United States, a recent paper published by researchers from the University's GEMS Informatics Center finds that the solution to sustainable wheat productivity growth lies in modern, scientifically-bred crop varieties. The study authors found that the increasingly intensive use of scientifically-selected crop varieties resulted in more biodiverse wheat production throughout the U.S., accompanied by a fourfold increase in average wheat yields over the past century.

Our Partnership with the University of Saskatchewan

To undertake a complementary, in-depth study of wheat varietal diversity and genetic improvements throughout Canada, the GEMS Informatics Center is partnering with Dr. Richard Gray’s team from the University of Saskatchewan to undertake joint research in support of the “4DWheat: Diversity, Discovery, Design and Delivery” project. The specific focus of this new study is to estimate the economic gains attributable to wheat varietal improvement in Canada and to identify the respective roles of landraces (farmer-bred varieties) along with Canadian and rest-of-world breeders in realizing these gains. In so doing, the study will quantify and characterize the shifting structure of varietal spill-ins to Canadian agriculture over the past half a century.

The first research objective of the GEMS-U Sask partnership is to evaluate the overall Genetic Gain (so-called G-gains) attributable to varietal improvement in Canadian wheat during the period 1970-2019. The study compiled comprehensive data on the areas planted to improved varieties coupled with detailed experimental data on the comparative yield performance of these varieties to assess the yield gains stemming from improved varieties relative to a chained counterfactual baseline of check varieties. To delve deeper into the different dimensions of the gains resulting from varietal improvement, we are dissecting the geography of genetic gains among the three major wheat-producing provinces (Alberta, Manitoba and Saskatchewan) and two specific classes of wheat (spring and durum).

Second, using a purpose-built data set developed by this project, we are also investigating the changing varietal diversity of Canadian wheat over the period 1970 to 2019, and partitioning the sources of yield/value gains into their various genetic parts using both phylogenetically-blind and phylogenetically-informed approaches. Our phylogenetically-informed approach utilizes the GEMS PedTools to map the lineage and evaluate the genetic relatedness among varieties when partitioning these gains. This analysis is designed to evaluate the economic value of the Canadian wheat crop that arises from various genetic sources, be that landraces, Canadian breeding programs, US breeding programs, and other international (e.g., CIMMYT/Mexico) research efforts. An additional feature of our approach is to identify the contributions coming from "dominant" varieties based on their prevalence and pedigree connections. Taken together, our findings will contribute to a better understanding of the dynamics and implications of varietal improvement in Canadian wheat crops.

Data-driven insights on the biodiversity and sustainability of wheat crops in Canada

Beginning in early 2020 our joint efforts have successfully compiled a novel Canadian wheat variety database that includes breeding passport information (both pedigree and phenotyping data) for over 310 commercial wheat varieties grown by Canadian farmers since 1970. Our initial results reveal that genetic improvements through breeding new wheat varieties are a dominant source of the overall yield gains achieved by commercial wheat farmers across the major wheat producing provinces in Canada. Furthermore, our new phylogenetically-informed partitioning procedures will help better align the costs and benefits associated with local R&D vis a vis research conducted elsewhere in the world. This work is also laying the quantitative foundations for practical, data-informed approaches to sharing the benefits arising from crop varietal change, a still often contentious aspect of the international agreements (e.g., the Nagoya Protocol embodied in the Convention on Biological Diversity) that shapes the access to and use of farmer versus scientifically bred crop varieties.

The key to sustainable agricultural productivity growth lies in embracing modern, scientifically-bred crop varieties that have demonstrated their ability to enhance biodiverse cropping practices and boost crop yields. Leveraging their respective expertise and data resources, the on-going partnership between the GEMS Informatics Center and the University of Saskatchewan is addressing the increasing challenges faced by cropping agriculture by providing data-driven insights on the biodiversity and sustainable productivity consequences of investments in modern crop breeding endeavors.

Reference:   
FAOSTAT. Accessed on July 31, 2023


​This activity supported in part by MnDRIVE Global Food Ventures, University of Minnesota