Case Study
GLOBAL CROP PEST RISK GEOGRAPHIES
Research-ready pest risk data
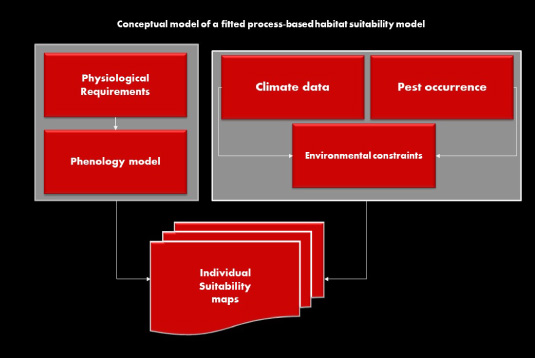
Over the past decade, the University of Minnesota's International Science & Technology Practice & Policy (InSTePP) center and its partners developed a portfoilo of pest risk geographies based on fitted, process-based, habitat suitability models. The risk estimates cover more than 24 pests that threaten wheat, maize and other crops worldwide. Partnering with InSTePP, GEMS has developed a Crop Pest API to provide ready access to spatialized pest risk measures on the GEMS grid.
Target Users
Information on where in the world particular crop pests are likely to pose more or less risk has value to farmers, agri-businesses (e.g., seed and chemical companies) and scientists (e.g., plant breeders, pathologists, entomologists and agricultural economists) for a host of different reasons. However, habitat suitability or species distribution modeling requires specialized skills. Our Crop Pest API couples these specialized pest modeling skills with our data science smarts in ways that provide ready-to-use, spatialized risks metrics that save end users considerable time and effort.
GEMS Services Used in Global Crop Pest Risk Geographies
Why spatialized pest risk data?
Accurate geographic information on the climatic potential for the establishment of a given crop pest threat greatly improves the effectiveness of biosecurity policies and practice. They are valuable for delineating quarantine areas, monitoring and regulating agricultural trade and targeting funds for threat prevention, mitigation or eradication purposes. These same data are also crucial for the cost-effective prioritization of pest data collection and monitoring activities. They also help inform plant pathologists, entomologists and plant breeders involved in the development and sustainable, spatially-explicit deployment of new pest resistant crop varieties or other pest management strategies. Changes in climate and shifts in the location of crop production add further value to these types of pest risk data.
Results
- Spatialized pest threat measures that distinguish between seasonally variable and sustained long-term risks.
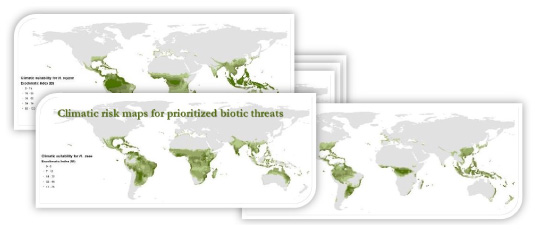
- All pests risks mapped on the GEMS Grid at a 10 x 10 km resolution worldwide.
- Over 24 crop pests are modeled and mapped, with a major focus on threats for wheat and maize but including selected threats for cassava.